Your Dashboard at a Glance
The Dashboard is the first page you see after you sign in. Once your team has a site, it shows the state of all your sites and servers on one screen, and each figure is a link to the sites behind it.
Until you have a site, the dashboard shows the Get started steps instead. The steps stay until all four are done, and the figures appear below them once your first site exists.
How the dashboard works
Section titled “How the dashboard works”- Tiles load after the page, in groups. If one fails, only that tile says Couldn't load this. Click Try again to reload it.
- The line Updated … ago above the first row tells you when the figures were counted.
- Each count opens the Sites list with the same filter, so the number on the tile and the length of the list always match. See Site list filters.
- A feature your team has not turned on shows No data yet and the action that turns it on. If you cannot take that action, the tile tells you why, for example Not in your plan or Ask an owner.
The four number tiles
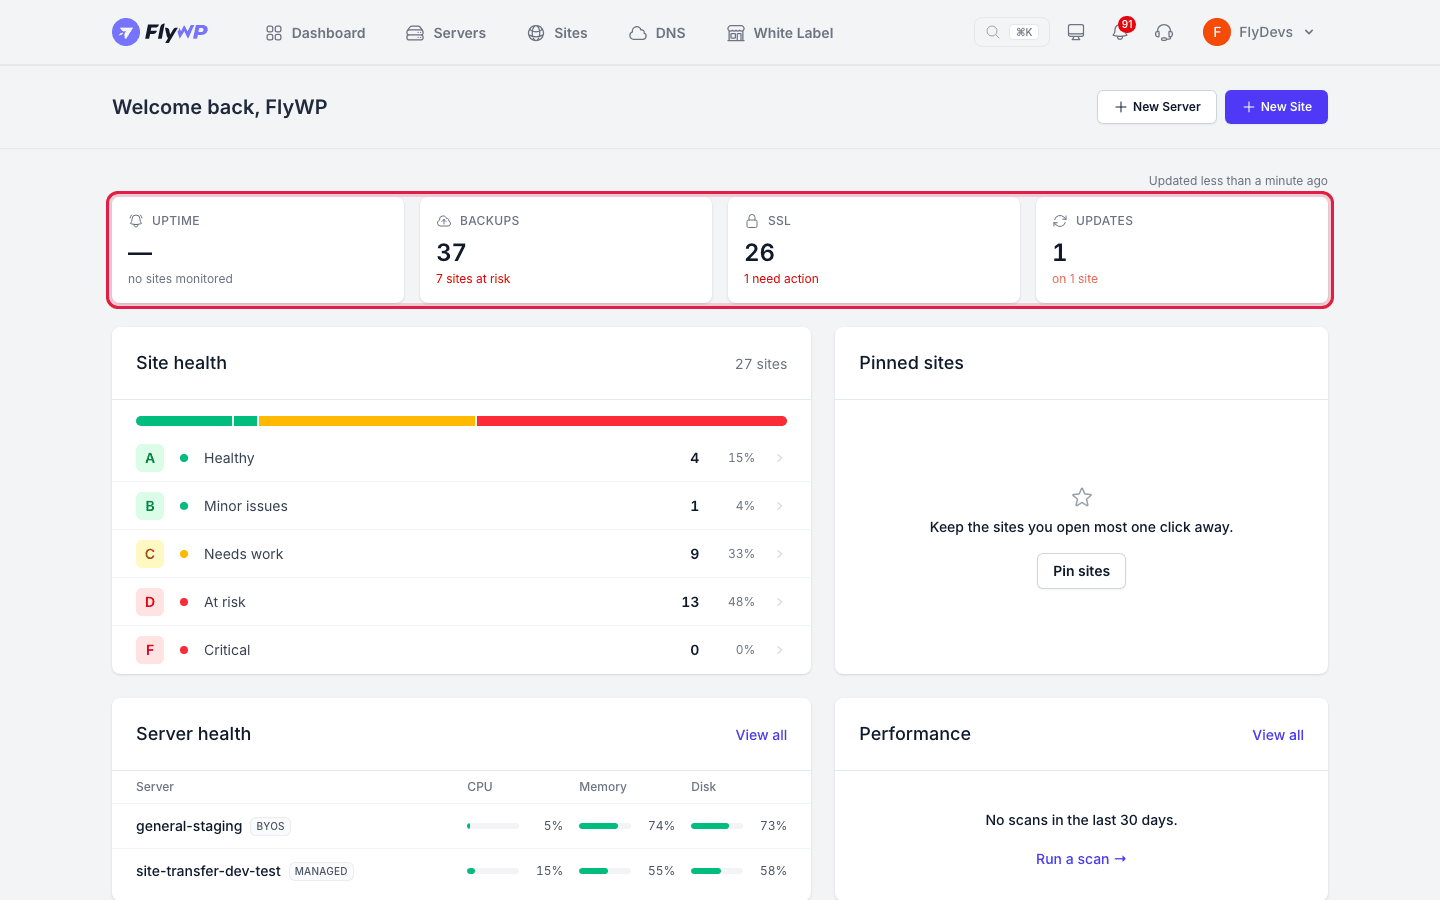
Section titled “The four number tiles”The top row has four tiles. Click a tile to open the sites it counts.
| Tile | What the number is | Opens |
|---|---|---|
| Uptime | The average availability of your monitored sites over the last 30 days, with the number of outages in the same 30 days. | Down in the last 30 days when there are outages, otherwise all sites. |
| Backups | The backups that finished successfully in the last 7 days. Below it: all ran · 7 days, or how many sites are at risk. | Backups at risk when a site is at risk, otherwise all sites. |
| SSL | The valid certificates on your live sites. Below it: all valid, or how many sites need action. | SSL needs action when a site needs action, otherwise all sites. |
| Updates | The pending WordPress core, plugin and theme updates. Below it: on N sites, or All up to date. | Updates available when there are updates, otherwise all sites. |
Good to know:
- Uptime needs the Uptime Monitor add-on. Without it, the tile says Not in your plan. A person who can manage billing sees Turn on uptime monitoring. With the add-on but no monitored site, the tile shows no sites monitored.
- Backups needs a plan with backups. Without one, the tile offers Upgrade to get backups. If none of your sites has backups set up, the tile offers Set up backups.
- Sites that can never be backed up, for example a site with no database, are left out of the backup counts. When none is left, the tile says nothing to back up yet.
- A site is at risk for backups when its backups are paused, its backup destination failed, or it has no successful backup in the expected time. The expected time is 2 hours for an hourly schedule and 26 hours for any other schedule. See Backups.
- A site needs SSL action when it is live and has no certificate, or its certificate is broken: the last renewal failed or it expires in 3 days or fewer. A certificate you uploaded yourself also counts when it expires within 14 days. Let's Encrypt certificates renew on their own, so a normal renewal does not count.
- The tile turns amber or red when something needs a look. Red means a certificate is broken now, or backups are at risk.
Site health
Section titled “Site health”The Site health tile gives every site a grade from A to F. It shows the number of graded sites, one bar for all of them, and a row for each grade with the count and its share. Click a row to open the sites with that grade.
| Grade | Meaning |
|---|---|
| A | Healthy |
| B | Minor issues |
| C | Needs work |
| D | At risk |
| F | Critical |
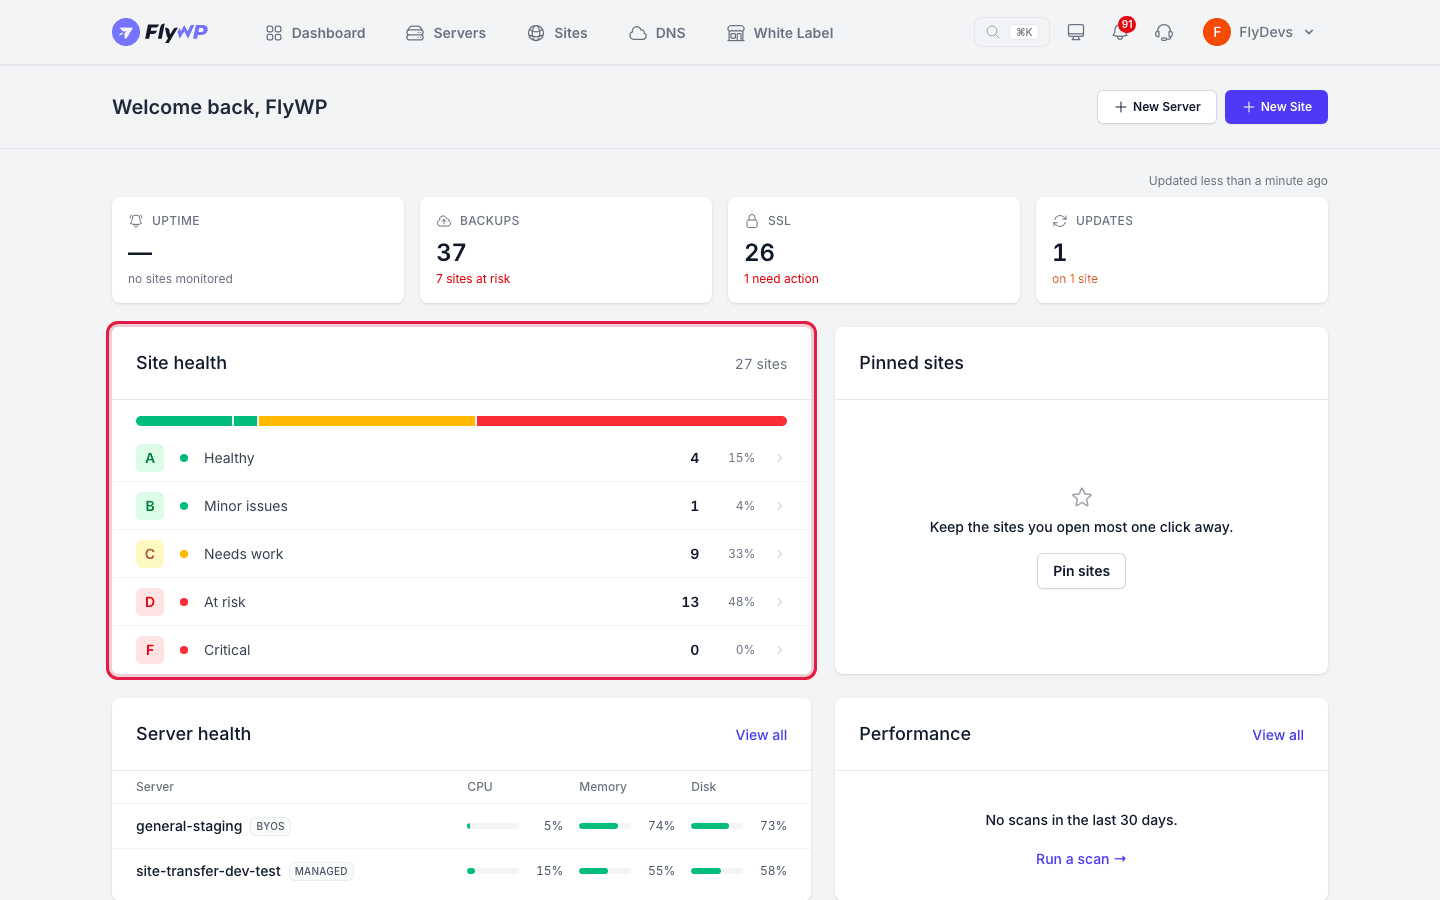
The worst problem sets the grade. A site with a plugin update (B) and a critical vulnerability (F) is an F.
| Grade | The site has at least one of these |
|---|---|
| F | A failed, rename-failed or disabled state. Down now. A service of a Docker Compose App is down. A critical vulnerability, or one that is being exploited. Backups paused or the backup destination failed. |
| D | A high-severity vulnerability. No backup set up. Uptime below 99% in the last 30 days. A mobile PageSpeed score below 50. |
| C | A medium-severity vulnerability. A WordPress core update. Backups at risk (no recent successful backup). A mobile PageSpeed score from 50 to 89. |
| B | A plugin or theme update. A low-severity vulnerability. Down at some time in the last 30 days. |
| A | None of the above. |
Rules to know:
- A signal a site does not have is skipped, never counted against it. A site with no uptime monitor, no PageSpeed scan or no vulnerability scan is graded on the rest.
- On a plan without backups, the backup checks are skipped.
- A site that is sleeping, being created or being deleted has no grade. A Docker Compose App that is stopped on purpose has no grade either. An app that FlyWP stopped for a full disk is an F.
- A new site shows No graded sites yet. A site gets its grade from A to F when it is live. until it has a grade.
Related guides: Vulnerability scanner, Backups, PageSpeed Insights.
Pinned sites
Section titled “Pinned sites”Pinned sites keeps the sites you open most one click away. Pins are yours: each person has their own pins in each team, and nobody else sees them.
To pin sites:
- On the Pinned sites tile, click Pin sites. When you already have pins, click + Pin more or Edit.
- Search with Search sites... and tick the sites you want.
- Click Save. Cancel changes nothing.
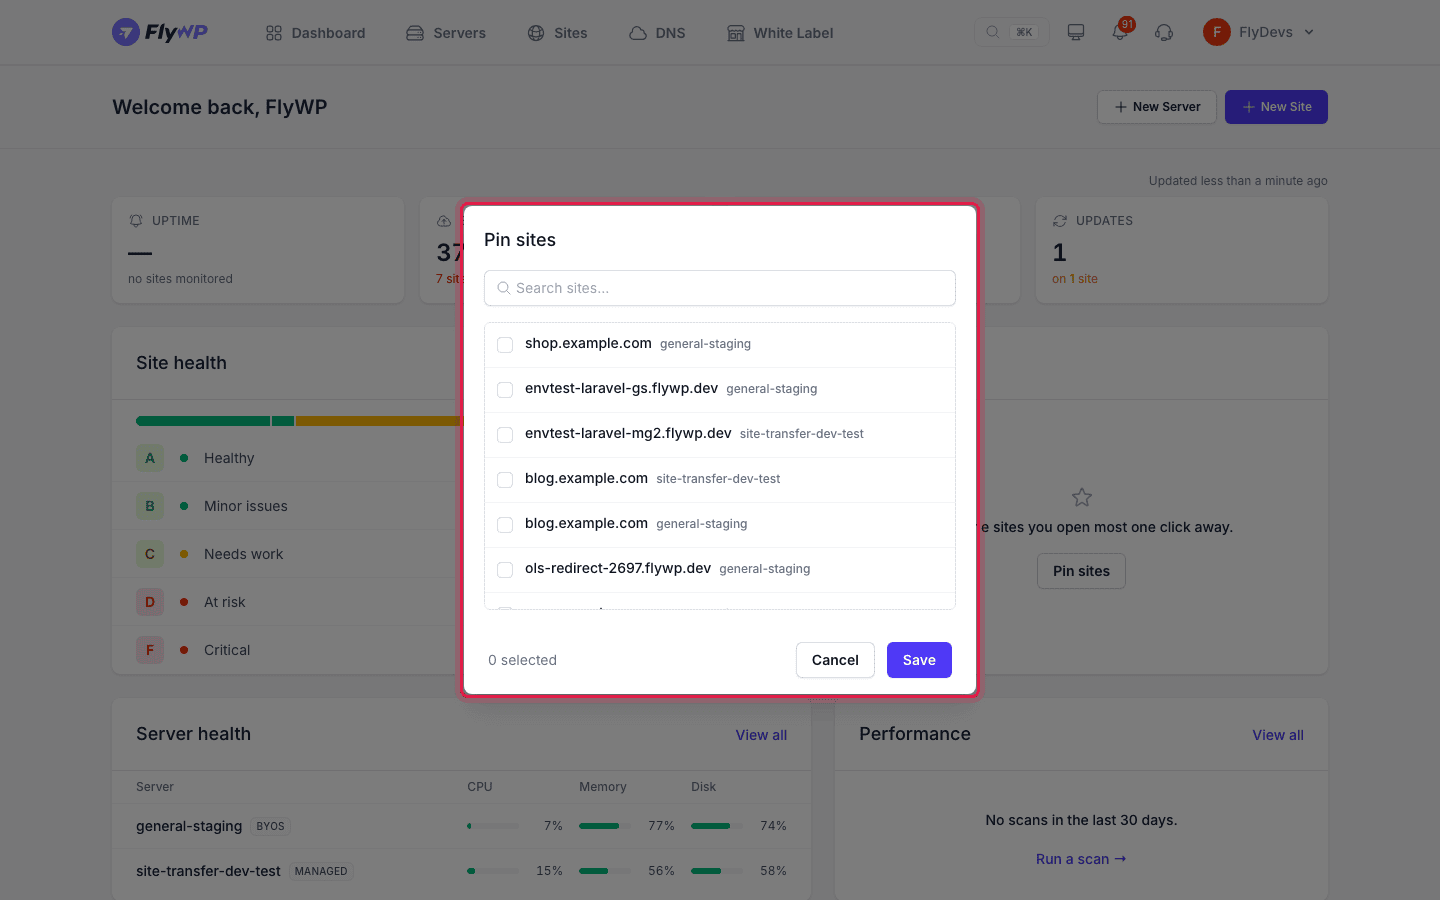
Each pinned site shows its server name, a Go to site button and an Unpin button. The tile shows five sites at a time and scrolls for more. You can pin only sites you can open.
Server health
Section titled “Server health”Server health shows CPU, memory and disk use over the last hour for the servers that need a look first. It lists up to five servers. Click View all (or View all N when you have more than five servers) to open the Servers page, or click a server to open its status page.
- A server that has not reported yet shows Provisioning. A server that FlyWP cannot reach, or whose agent stopped reporting, shows Offline. A server with no reading in the last hour shows No data.
- A bar turns amber from 80% and red from 90%.
- A badge shows whether the server is MANAGED or BYOS (bring your own server).
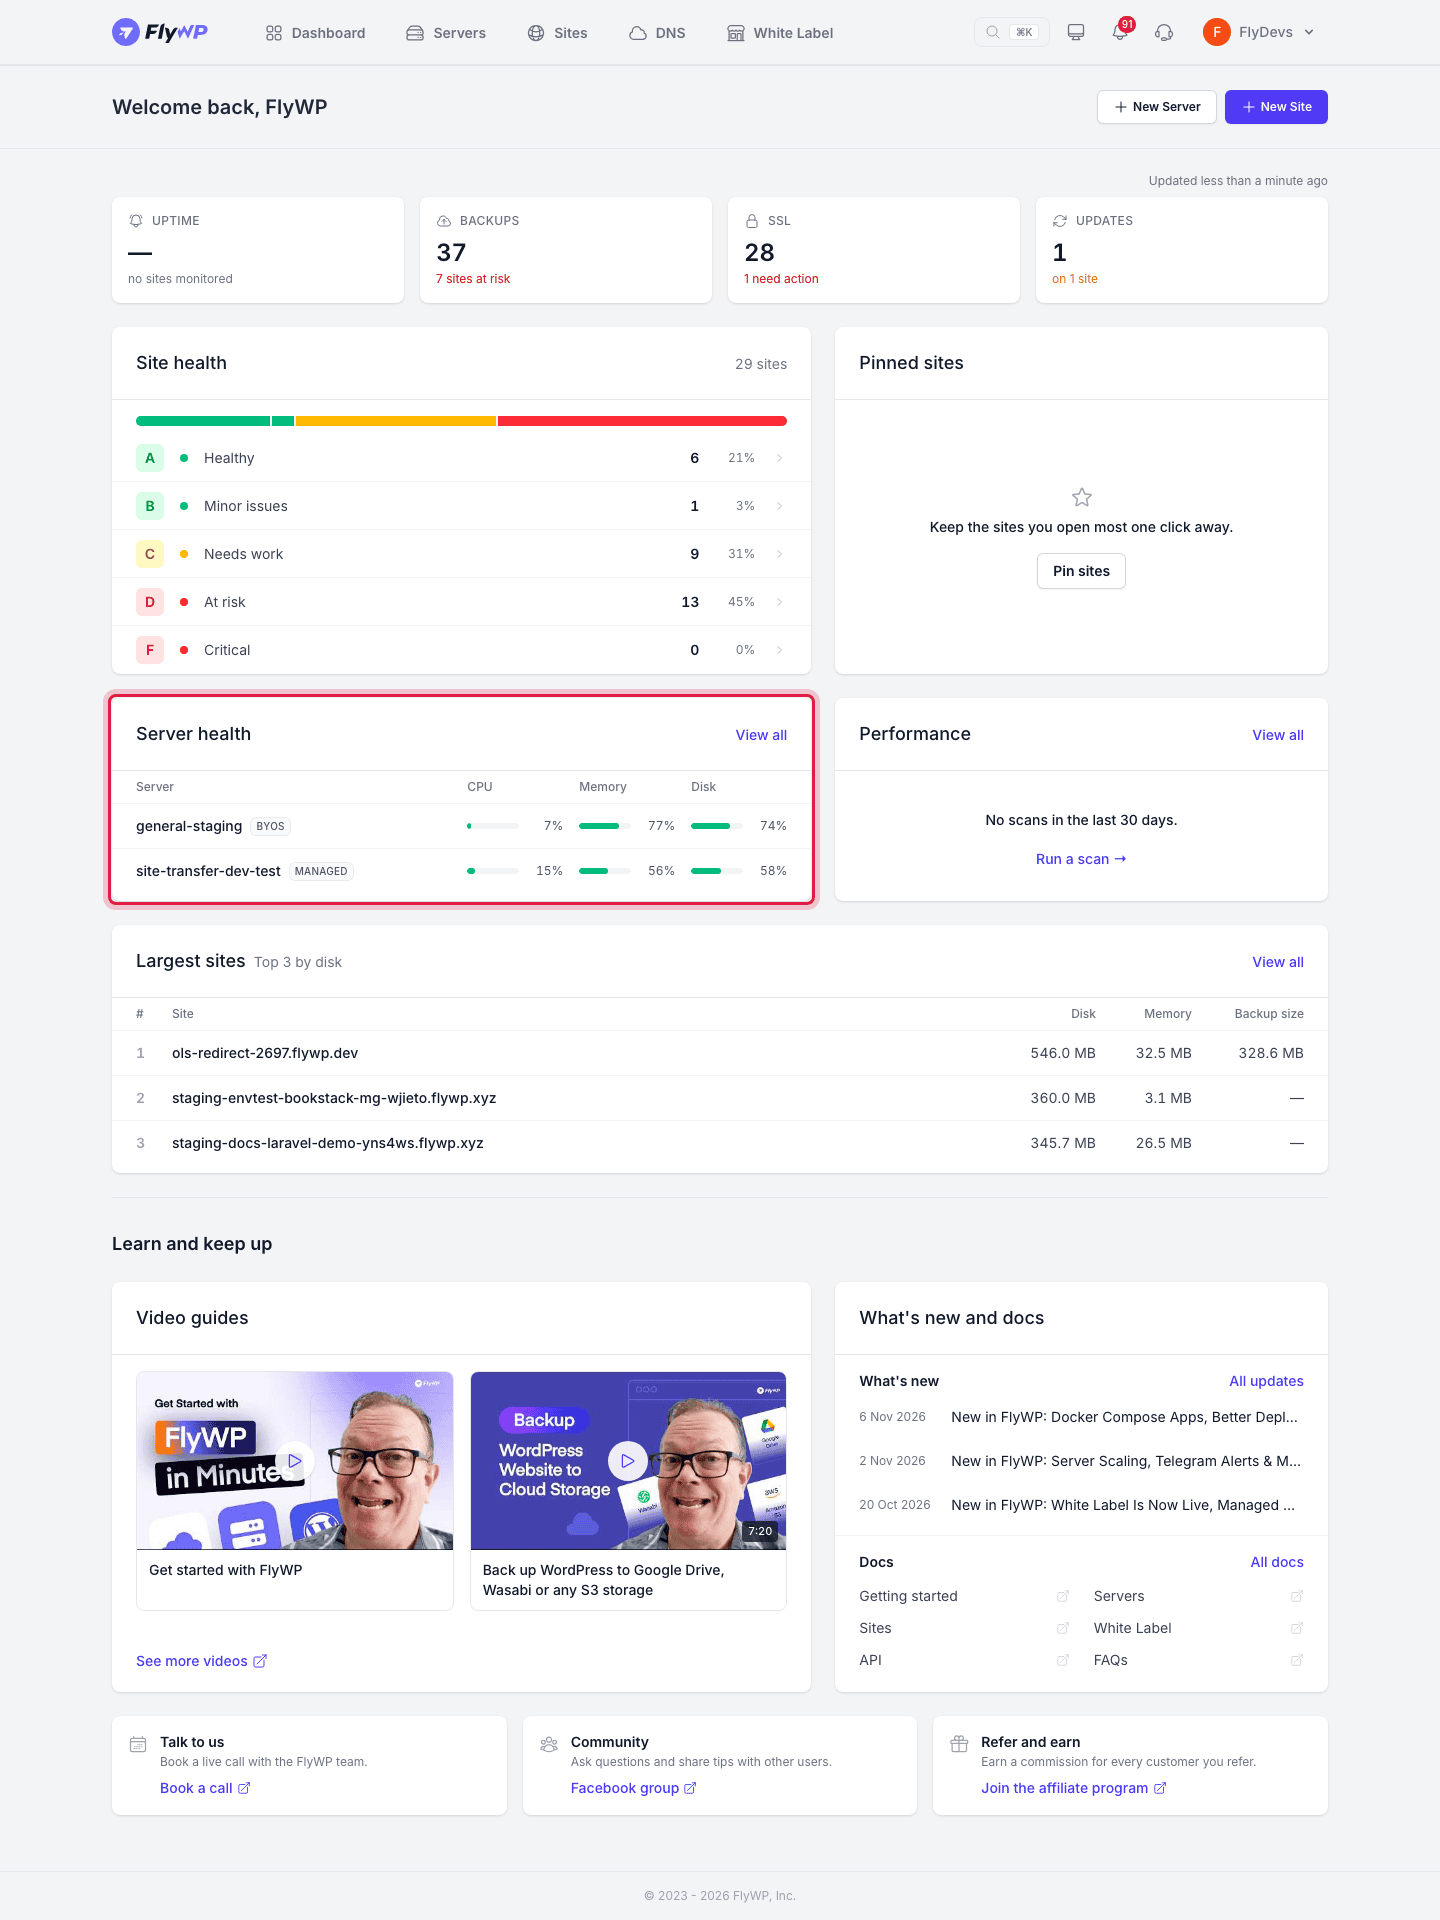
The tile shows when you can list servers and at least one server has the monitoring agent. Without the agent, Unlock more offers Install. See Server status.
Performance
Section titled “Performance”Performance lists the 5 slowest sites on mobile, from each site's latest PageSpeed scan in the last 30 days. It shows a Mobile and a Desktop score for each site. A score from 90 to 100 is good, 50 to 89 needs work and below 50 is poor.
With no scan in the last 30 days, the tile says No scans in the last 30 days. and offers Run a scan →.
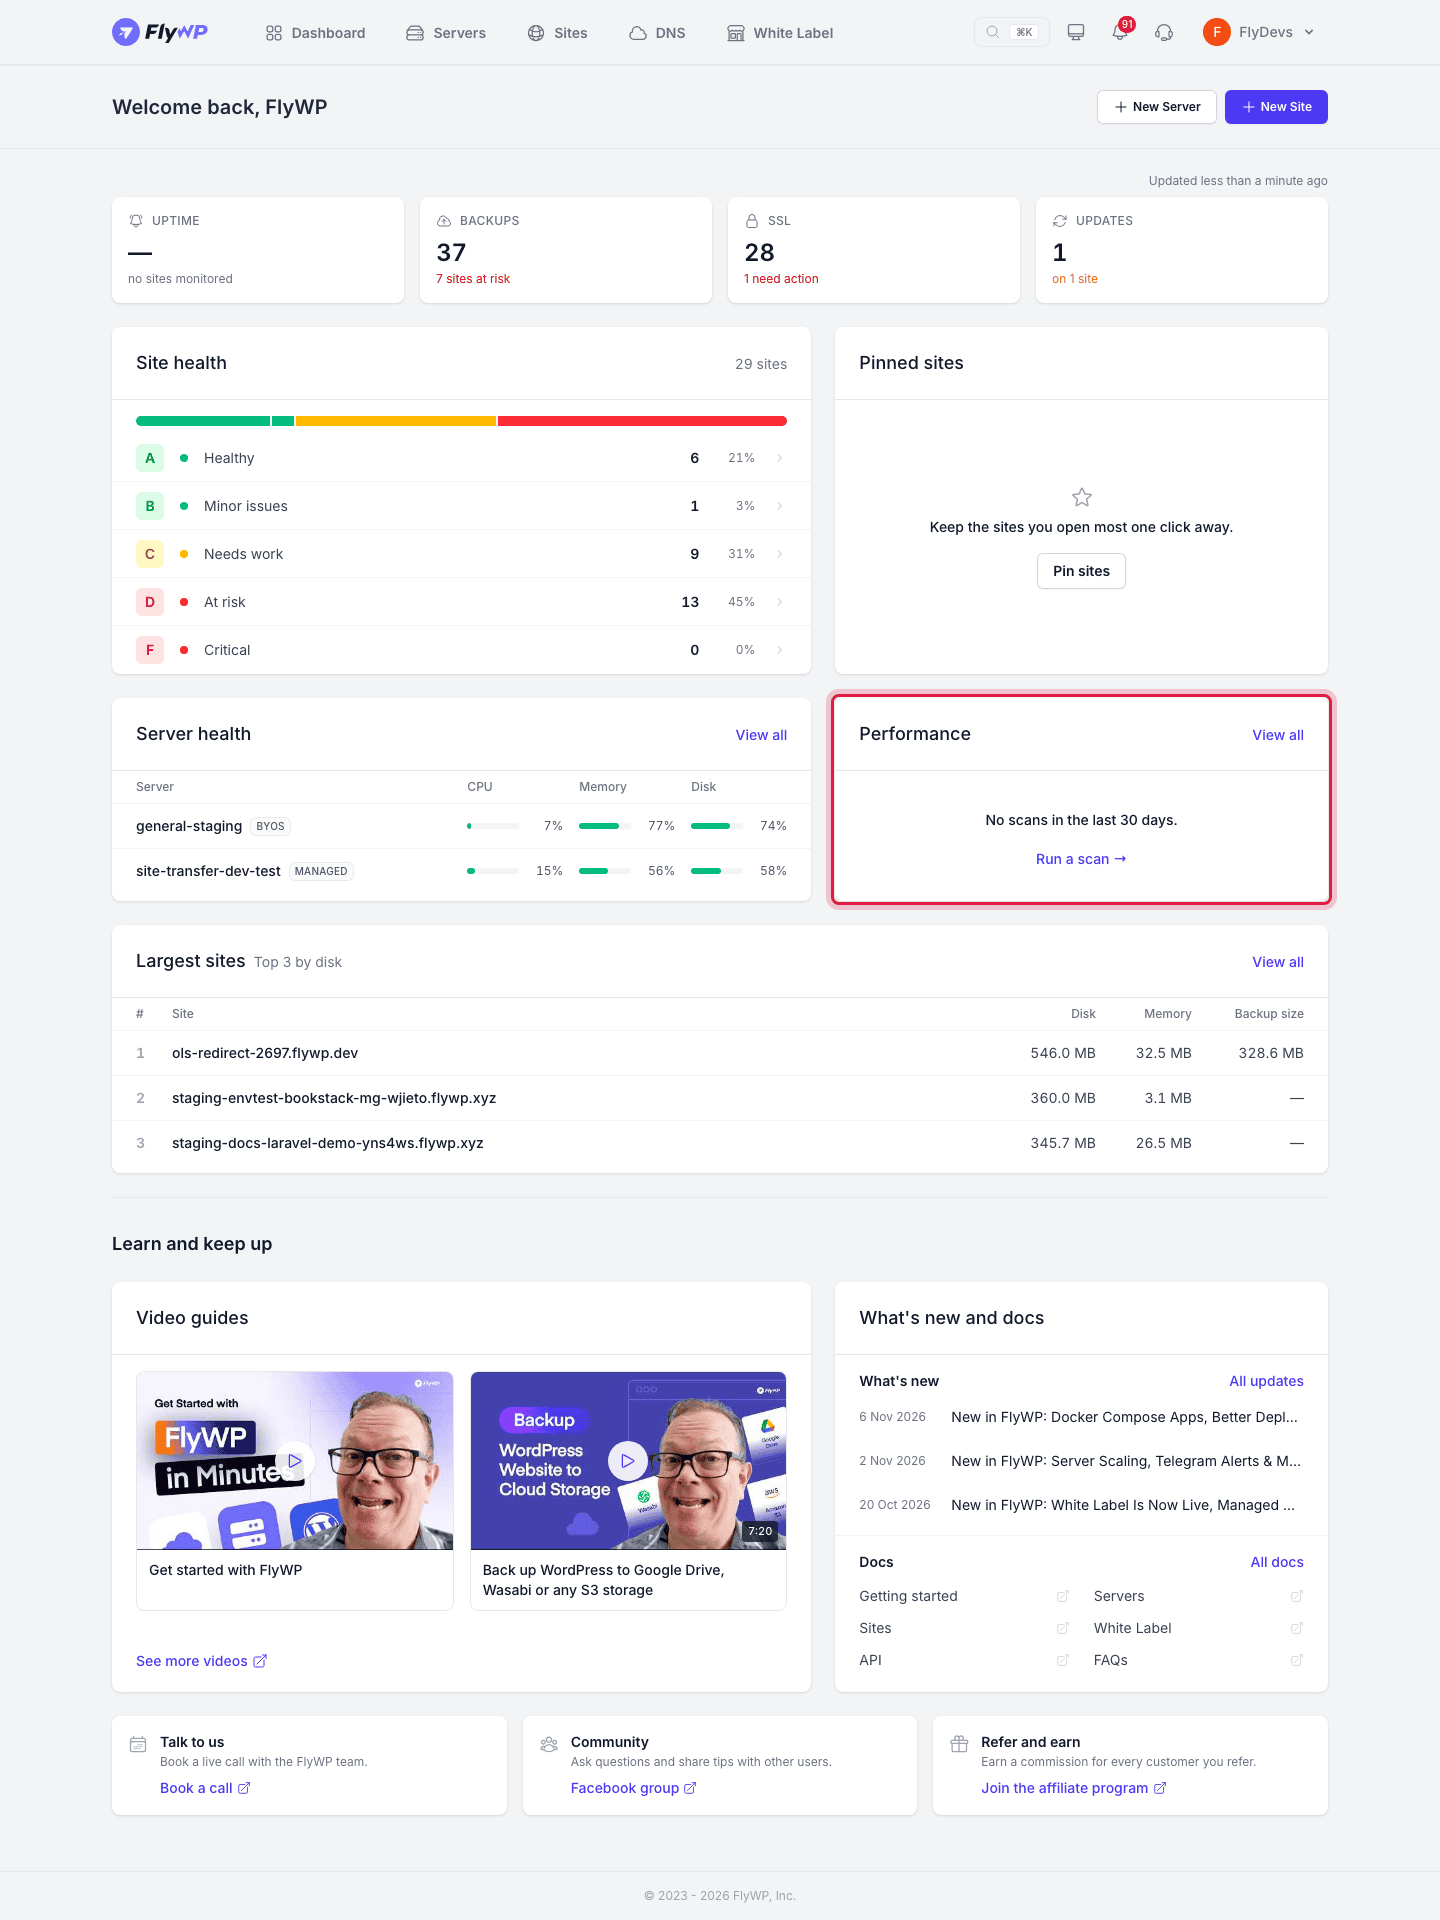
The tile needs a Google PageSpeed API key on your team. See PageSpeed Insights.
Largest sites
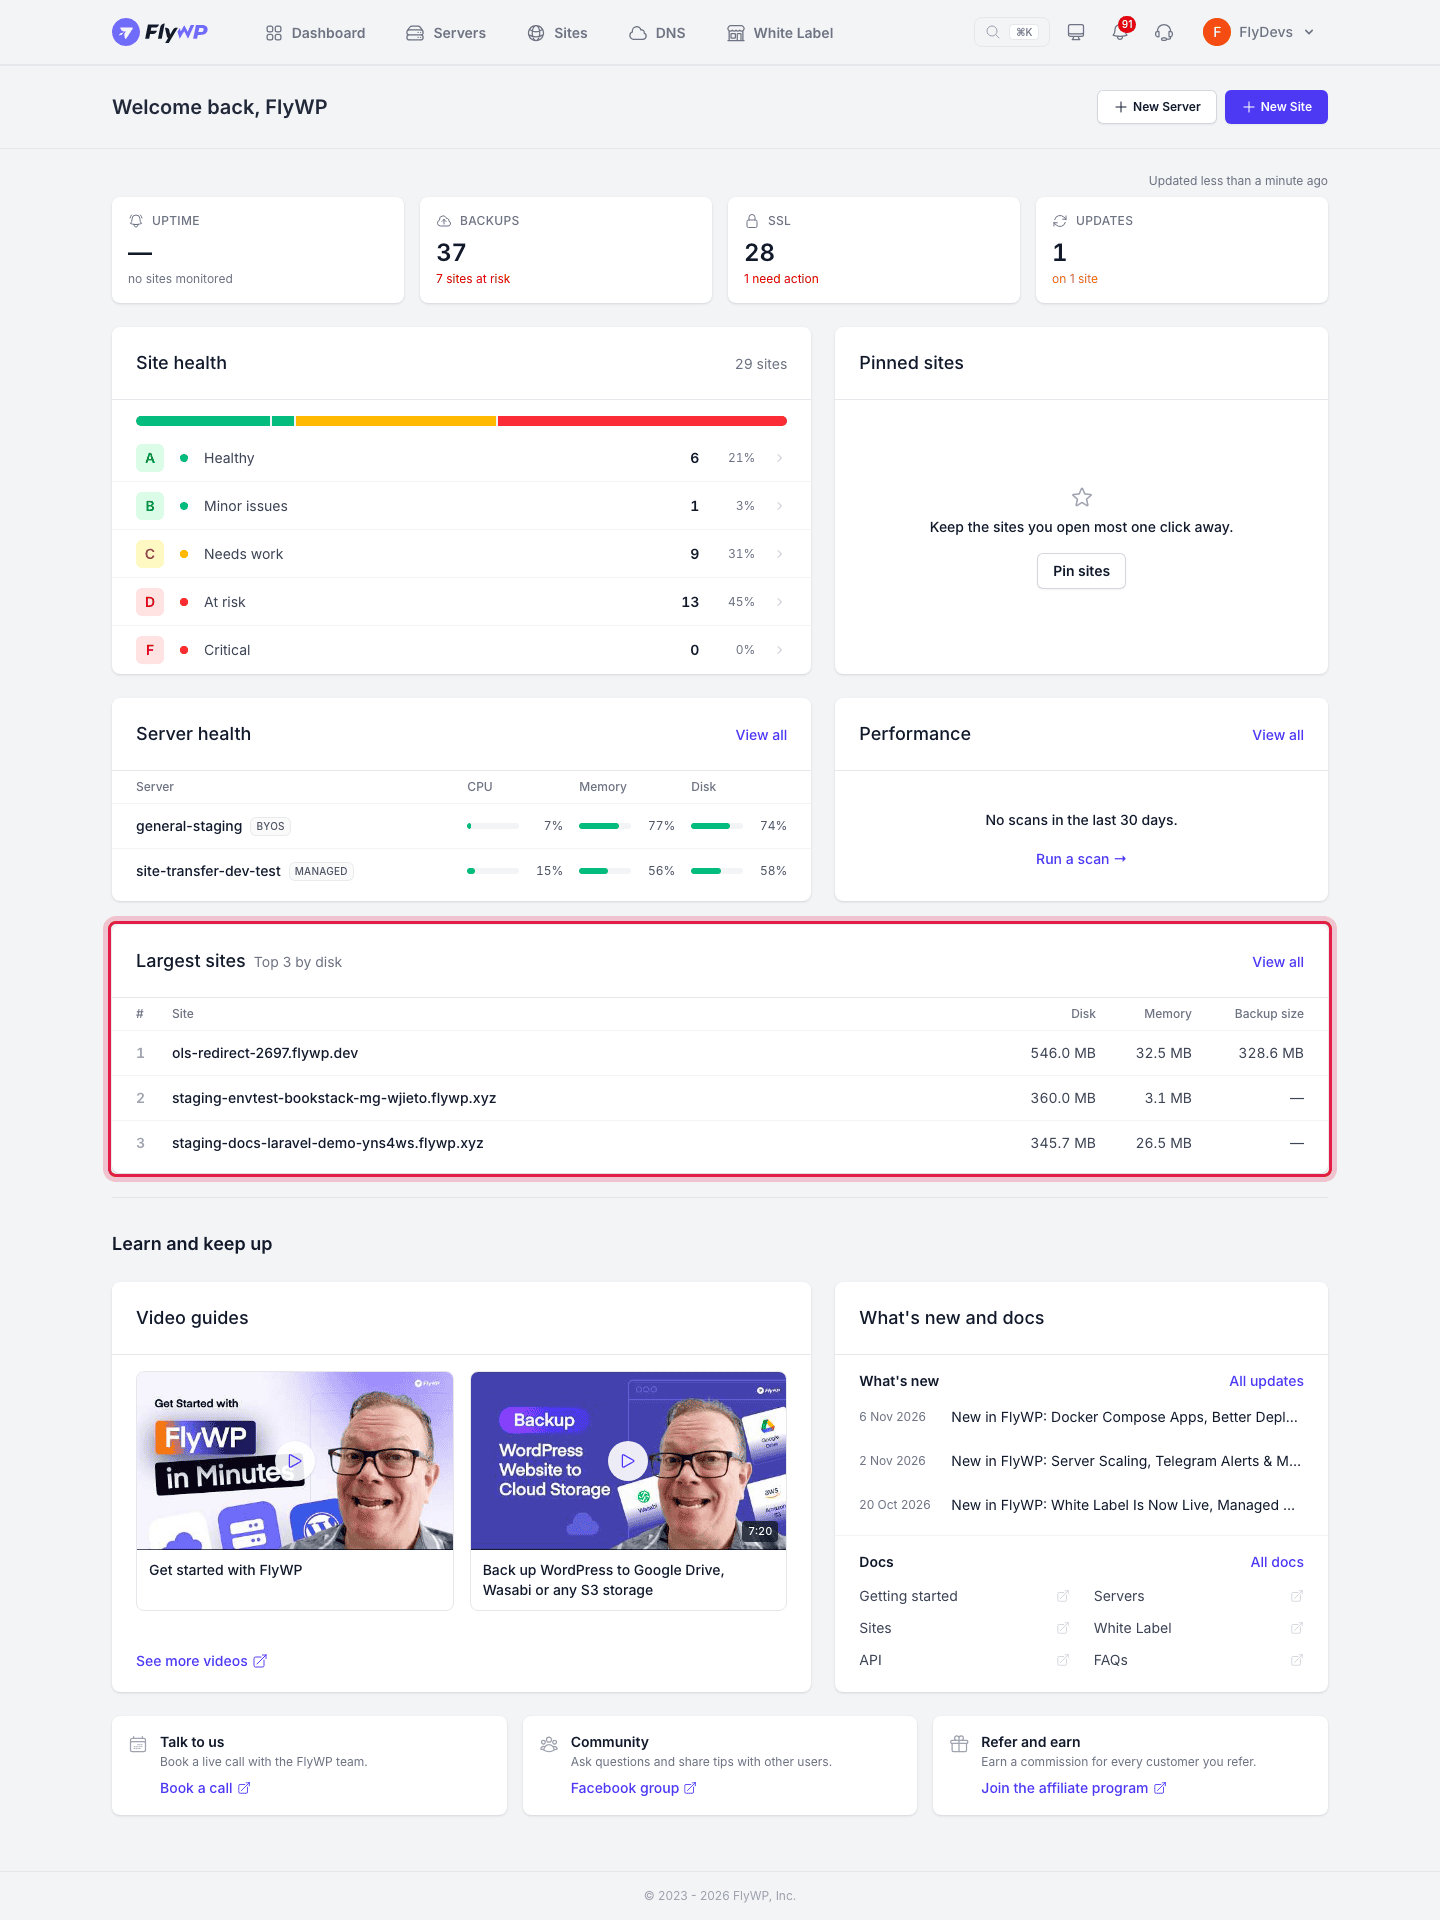
Section titled “Largest sites”Largest sites ranks the top 3 sites by disk use. For each one it shows Disk, Memory and Backup size, the size of its latest successful backup. Until the monitoring agent reports disk figures, the tile says No disk figures yet.
Unlock more
Section titled “Unlock more”Unlock more lists what your team can turn on but has not yet. Each item has one action:
| Item | What it does | Action |
|---|---|---|
| Server health | Install the monitoring agent to see CPU, memory and disk. | Install |
| Performance | Add a Google PageSpeed API key to score your sites. | Add key |
If you cannot manage the team, the item says Ask an owner. The tile disappears when there is nothing left to unlock.
Learn and keep up
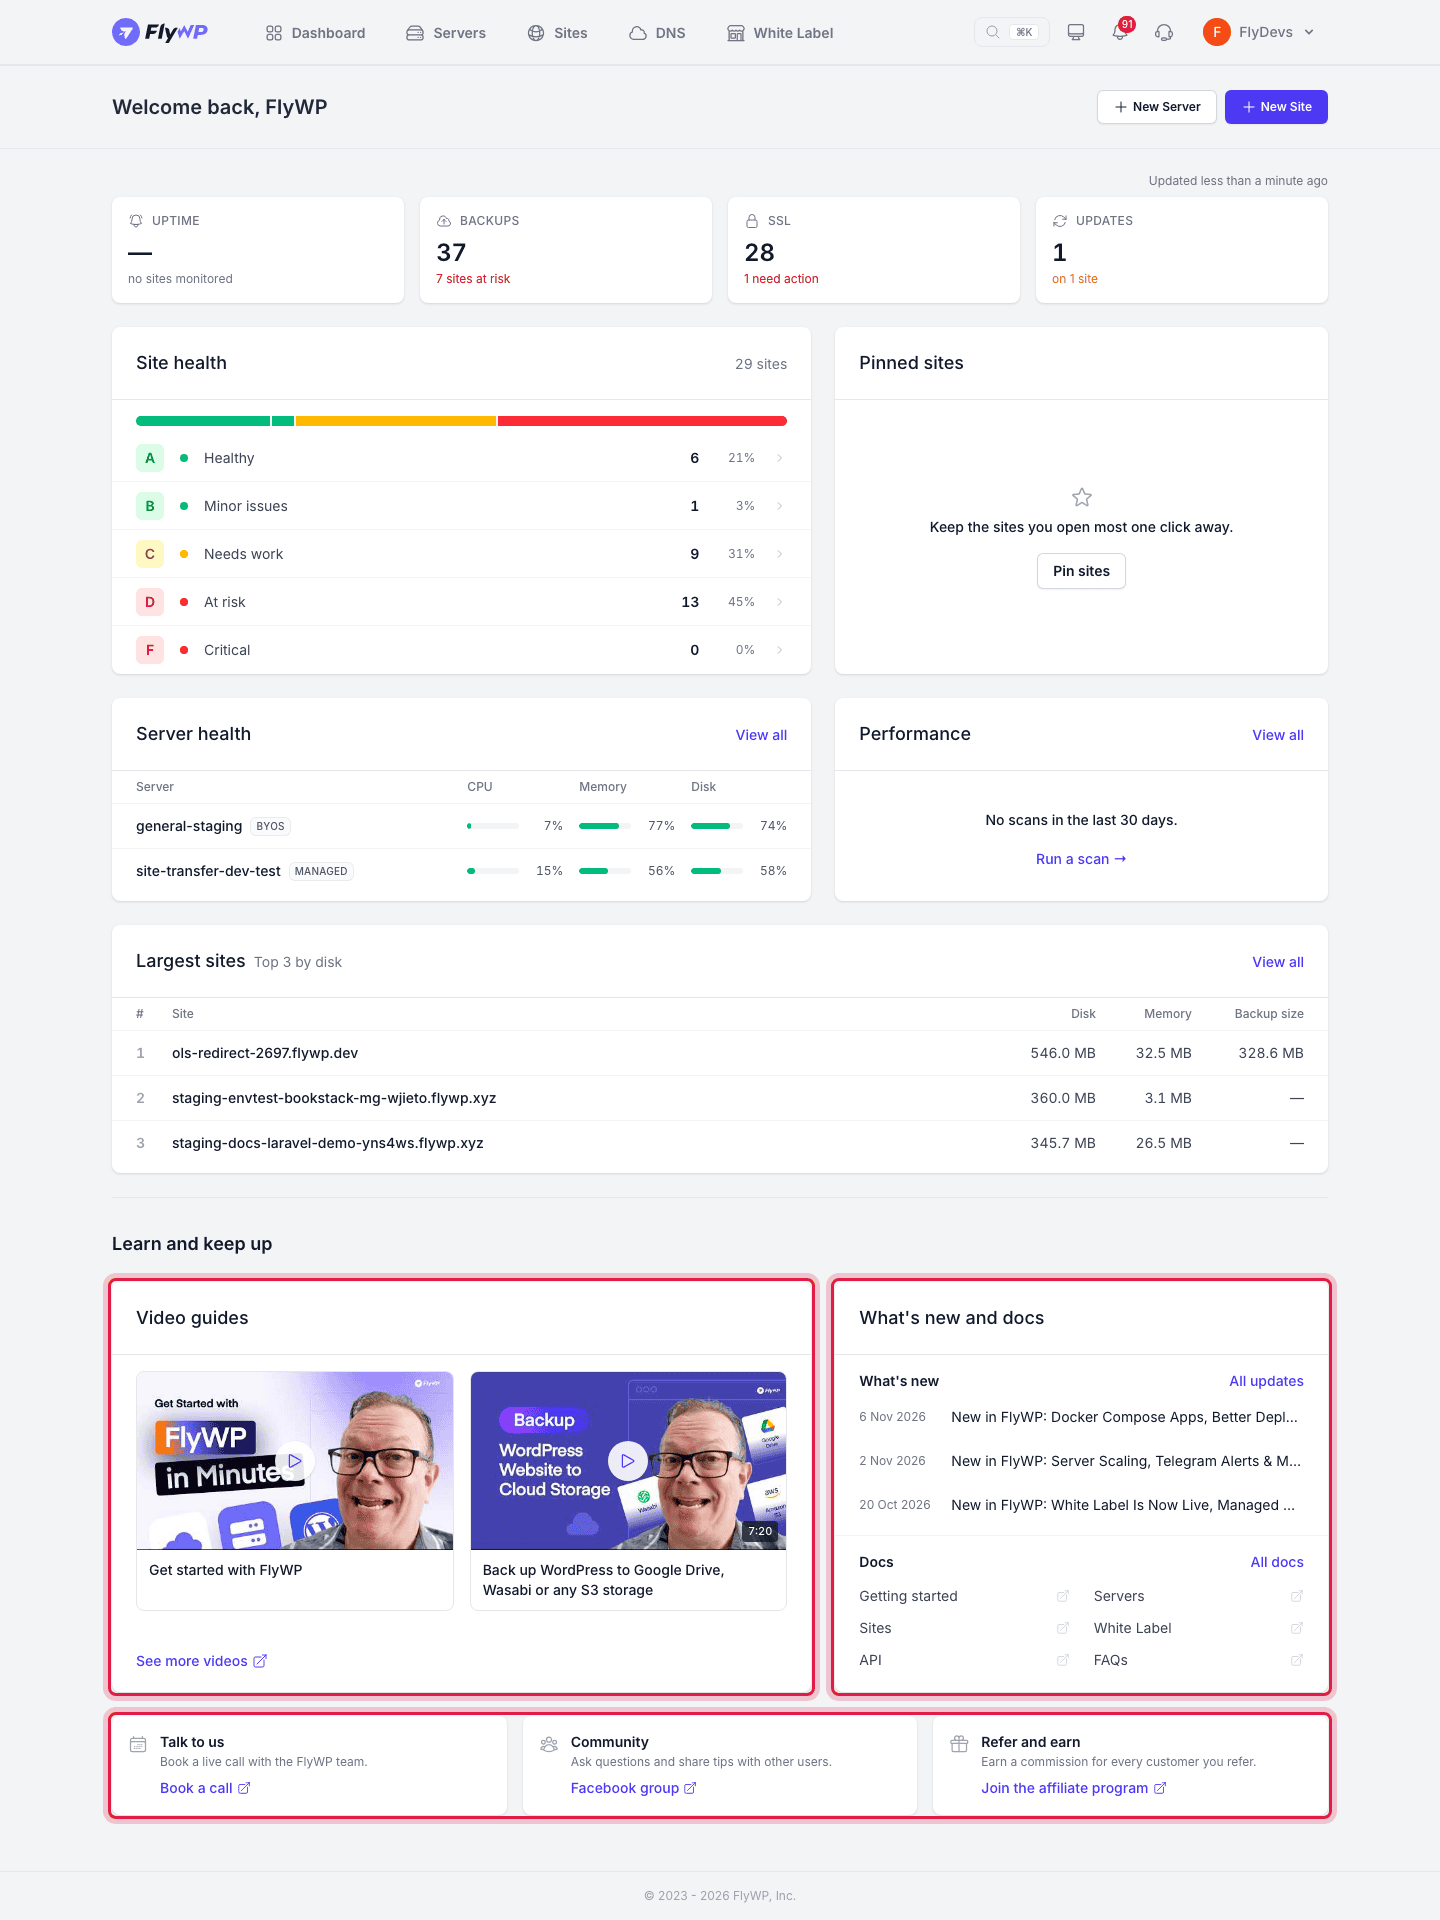
Section titled “Learn and keep up”The bottom of the dashboard has help and news:
- Video guides with a link to See more videos.
- What's new and docs: the 3 latest releases from the public FlyWP changelog. Click a release or All updates to read the last 10. Below them, links to the docs.
- Talk to us with Book a call, Community with Facebook group, and Refer and earn with Join the affiliate program.
Site list filters
Section titled “Site list filters”Every count on the dashboard opens the Sites page with a filter. You can also pick a filter yourself from the Filter sites menu, next to the search box. The default is All sites.
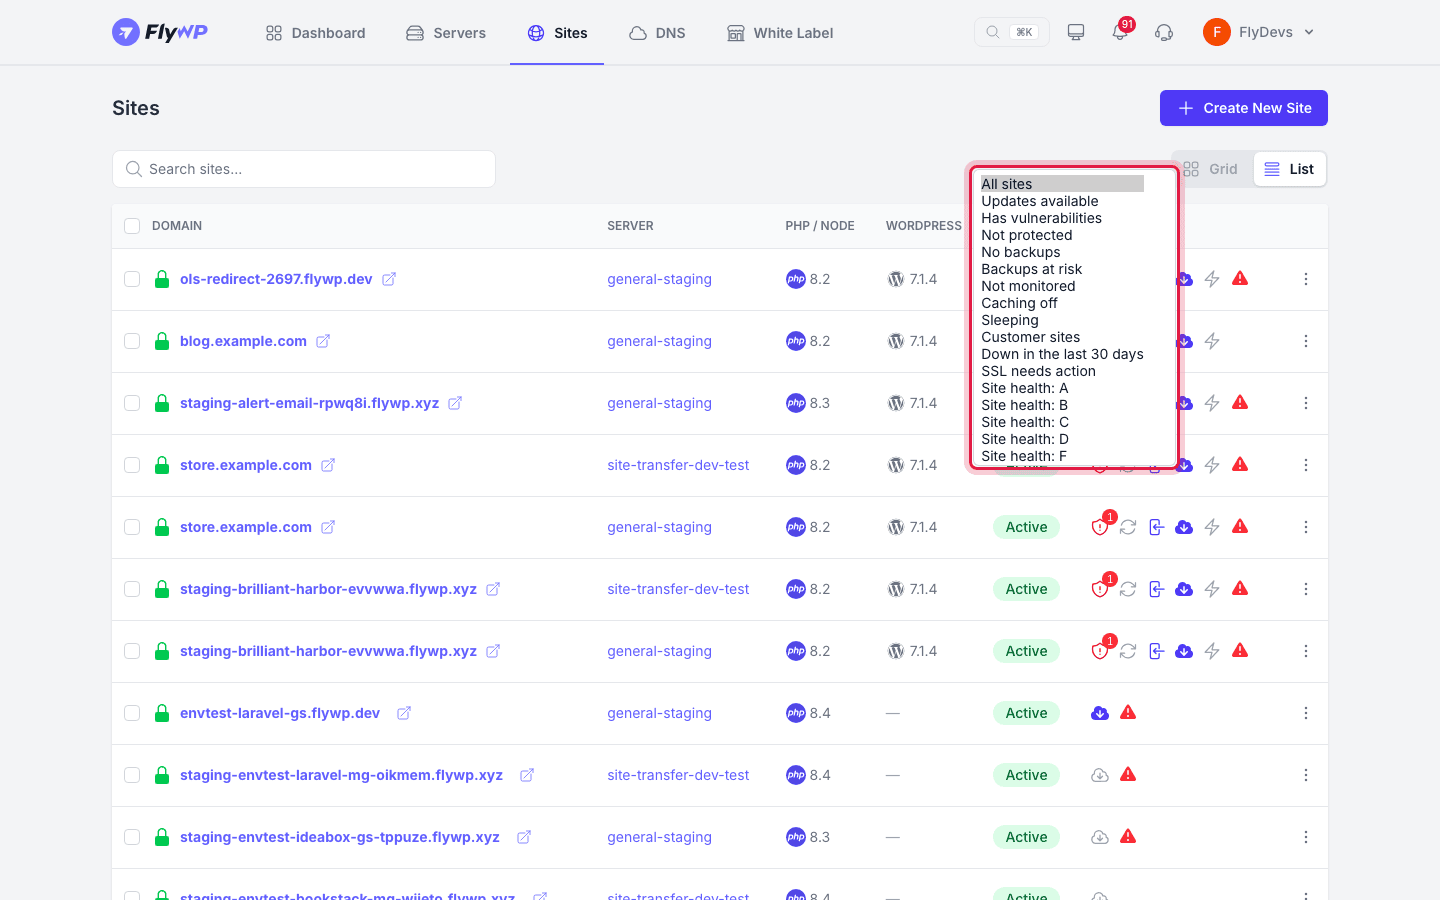
The filters the dashboard added:
| Filter | Shows |
|---|---|
| Down in the last 30 days | Monitored sites that were down at some time in the last 30 days, including a site that is still down. |
| SSL needs action | Live sites with no certificate or with a certificate that needs action. |
| Site health: A to Site health: F | The sites with that health grade. |
The menu also has Updates available, Has vulnerabilities, Not protected, No backups, Backups at risk, Not monitored, Caching off and Sleeping. Staff of a team with White Label customers also get Customer sites. A chip with the filter name shows above the list. Pick All sites to go back to the full list.
Related pages
Section titled “Related pages”Still stuck? How can we help?
View as Markdown