
Your server might be running, but is it running well? That’s where server performance metrics step in. That’s where server performance metrics become relevant. These aren’t just numbers or reference points; they’re the pulse of your site, app, and business. Every slow load, timeout, and CPU spike is a warning. Ignoring them will make you fly blind.
Whether you’re managing a WordPress site on FlyWP, scaling a SaaS platform, tracking the right server metrics, and trying to keep users happy, isn’t optional. You must consider it to have a sustainable business. Why? Because slow servers don’t just frustrate users. They reduce conversions, affect your SEO, and flood your inbox with angry support tickets.
In this guide, we’ll walk through the most essential server metrics to monitor, share practical benchmarks, and give you a cheat sheet you’ll actually need to bookmark. Let’s build a server that’s fast, stable, and always ready for action.
Server Performance Metrics: What They Are and Why They Matter
Server performance metrics are like your system’s vital signs. They tell you how healthy your server is, how hard it’s working, and when it’s showing signs of stress. From CPU spikes to memory leaks, these numbers reveal the story your server can’t tell out loud. In simple terms, these metrics are the numbers that tell you how your server is doing behind the scenes. And, they help you find answers to crucial questions like:
- Is the server fast enough?
- Is it under too much load?
- Are there bottlenecks slowing things down?
- Can it handle more traffic?
And they’re not just for system admins (sysadmins). Developers, site owners, and even product teams benefit from watching these numbers. Because when a site is slow or crashes, users won’t wait. They’ll bounce. And worse? You might not even know what went wrong unless you’re watching the right metrics. If you’re running WordPress on a VPS, managing client sites, or scaling a SaaS app, knowing what to monitor and why can mean the difference between smooth sailing and firefighting.
Why Server Performance Metrics Matter More Than You Think

Why should you care about server performance metrics? Because they’re your early warning system. If your site slows down or crashes when traffic spikes, chances are one of these metrics is trying to tell you something. Keeping an eye on them helps you spot problems before users start complaining. You can plan upgrades based on real data, not guesses. Plus, a faster site means better SEO and fewer frustrated visitors. Fewer crashes mean more trust from your customers. Simple as that.
The 5 Essential Categories of Server Performance Metrics
To truly monitor and fine-tune server performance, you need to look at it from multiple angles. These five categories break it down neatly. Each one includes a clear definition followed by a real-life example to help you visualize how it plays out in actual server environments:
a. Compute Performance Metrics
These metrics show how your server’s brain (CPU) and memory (RAM) are handling the workload.
1. CPU Usage
CPU usage is the percentage of total processing power currently being used. It shows how busy the processor is at any given time.
Example: Imagine your WordPress site runs a large backup plugin every night at 2 AM. During this task, CPU usage spikes to 95%, meaning the server is almost maxed out. If multiple users visit the site at the same time, it may slow down or even time out.
2. CPU Load Average
CPU Load Average is the average number of processes either running or waiting for CPU time over the last 1, 5, and 15 minutes. It indicates system workload relative to CPU capacity, helping identify sustained overload when adjusted for the number of cores.
Example: On a 4-core server, a load averages of 6.2, 5.8, and 5.6 indicate the system is ~1.5x overloaded (~1.55 processes per core). If I/O wait is low, this suggests a need for more CPU-intensive resources; if high, disk or network bottlenecks may be the culprit.
3. Memory Usage (RAM)
Memory usage tracks how much of your physical RAM is being used versus how much is free. It reflects how efficiently your server handles memory-dependent tasks.
Example: Let’s say your WooCommerce store uses a caching plugin. Without it, the site consumes 80% of RAM. With caching, memory usage drops to 50%. That saved memory can now go toward handling more customer traffic during a sale. Beyond caching, you can also consider increasing RAM or using a memory-efficient PHP version.
4. Swap Usage
Swap usage shows how much virtual memory (stored on disk) is being used when physical RAM is full. Using swap is much slower and can hurt performance.
Example: If your server has 4GB of RAM and it’s all used up during a traffic spike, the system moves data to a 2GB swap space. Your site may start lagging or freezing, especially if it depends on fast database queries or page loads.
5. Context Switches
A context switch happens when the CPU switches from one task to another. High context switch rates indicate the CPU is juggling too many tasks, which adds overhead.
Example: Think of a project manager constantly hopping between meetings every 2 minutes. That’s inefficient just like a CPU doing 50,000 context switches per second. This could happen on a VPS hosting multiple websites with conflicting cron jobs.
6. Interrupts per Second
Interrupts are signals from hardware (like disks or network cards) that demand immediate CPU attention. This metric shows how often these signals occur.
Example: Picture a server handling real-time video streaming. The network card constantly sends interrupts for incoming video data. If interrupts per second suddenly spike, it might mean a misconfigured driver or faulty hardware is bombarding the CPU, slowing everything down.
Optimization Tips: To reduce high CPU usage, optimize application code, offload tasks to background workers, or upgrade to a higher-core CPU. For high swap usage, increase RAM or tune swappiness settings.
b. Storage Performance
Metrics that assess disk and storage system performance are essential for data access speed and overall site responsiveness.
1. Disk I/O
Disk I/O measures how frequently your system performs read/write operations on the disk. It reflects how actively the server is accessing files or databases.
Example: You’re running a WooCommerce store with a large image gallery. Every product page loads high-res images, and a sudden surge in users means the disk is flooded with read requests. If your Disk I/O spikes too high, it slows down image loading and crashes the checkout process.
2. Disk Latency
Disk latency is the time it takes for a disk operation, like reading or writing a file, to complete. Lower latency means faster performance.
Example: Suppose your blog takes 4–5 seconds to load each page. After checking, you find the disk latency is over 100ms. That means your server is taking too long just to fetch files from storage. Switching to an SSD drops the latency to under 1ms and page speed improves instantly.
3. Disk Throughput
Disk throughput measures the volume of data being read or written per second, usually in MB/s. It reflects how quickly your server can transfer data to and from the disk.
Example: You’re streaming large audio files to users. During peak hours, throughput maxes out at 80 MB/s on a 100 MB/s-capable SSD. That’s efficient. But if you see it’s stuck at 15 MB/s with laggy playback, you might be hitting a bandwidth bottleneck or slow disk performance.
4. Disk Utilization
Disk utilization is the percentage of time the disk is actively working. High utilization over long periods may indicate the disk is a performance bottleneck.
Example: Your database is hosted on a single spinning hard drive. During Black Friday, disk utilization jumps to 99% for hours, which means it’s overwhelmed. Queries take longer, and your site becomes unresponsive. An upgrade to SSDs or RAID helps distribute the load.
5. IOPS (Input/Output Operations Per Second)
IOPS measures how many read and write operations your disk can perform each second. It’s crucial for apps that handle many small transactions.
Example: Let’s say you manage a membership site with thousands of logins per hour. Each login triggers multiple read/write actions. If your server’s IOPS limit is 3,000 and your traffic requires 5,000, users may get login errors or see spinning loaders.
6. Disk Space Usage
This metric shows how much of your total disk capacity is being used, typically as a percentage.
Example: You host multiple WordPress sites on a shared server. One site uploads daily backups to the same disk. After a month, disk usage hits 95%, and new uploads fail. Even worse, databases can’t write new entries. Regular cleanup or automated storage management could’ve prevented it.
Optimization Tips: Mitigate high disk latency by switching to NVMe SSDs, using RAID for redundancy, or optimizing database queries to reduce IOPS demand.
c. Network Performance
Metrics that evaluate network efficiency and connectivity, key for smooth, fast data transfer between your server and users.
1. Network Throughput
Network throughput measures the amount of data your server sends or receives per second, usually in bytes or megabytes per second.
Example: You run a video streaming site. During peak hours, your throughput hits 500 Mbps, maxing out your server’s network card. Viewers start experiencing buffering. Upgrading to a higher bandwidth plan or using a CDN can help fix this.
2. Network Latency
Network latency is the time it takes for data to travel from the server to the client and back, measured in milliseconds.
Example: Your global blog has readers from Europe and Asia. European visitors see page load delays because latency is 300 ms from your US-based server. Using a Content Delivery Network (CDN) reduces latency by serving cached content closer to users.
3. Packet Loss
Packet loss is the percentage of data packets lost during transmission between the server and the client. Lost packets must be retransmitted, causing delays.
Example: During a live webinar, 5% packet loss causes video freezes and choppy audio for attendees. Troubleshooting reveals faulty network hardware causing dropped packets, which was fixed by replacing the switch.
4. Bandwidth Utilization
This is the percentage of your total available network bandwidth currently in use.
Example: Your eCommerce site usually uses 40% of its 1 Gbps bandwidth. But during a flash sale, utilization spikes to 95%. The server struggles to send data, and some users can’t even reach the homepage.
5. Connection Rate
The number of new network connections established per second by clients to your server.
Example: Your API server limits connections to 200 new ones per second. During a marketing campaign, connection rate spikes to 400 per second, causing the server to reject or drop excess connections, leading to app errors.
6. Error Packets
The count of corrupted or malformed data packets detected during transmission.
Example: After a firewall update, error packets spike because legitimate traffic is mistakenly blocked or malformed. This causes slow website responses and API failures until rules are fixed.
Optimization Tips: Lower network latency with a CDN, increase bandwidth for high throughput, or fix packet loss by upgrading network hardware or adjusting MTU settings.
d. Application Performance
Metrics that focus on how efficiently your server handles application-level requests, directly impacting user satisfaction and business goals.
1. Response Time
The total time it takes for your server to process a request and send back a response.
Example: Visitors to your online store expect pages to load quickly. If the response time spikes from 200ms to 2 seconds during a sale, customers might abandon their carts, costing you sales.
2. Time to First Byte (TTFB)
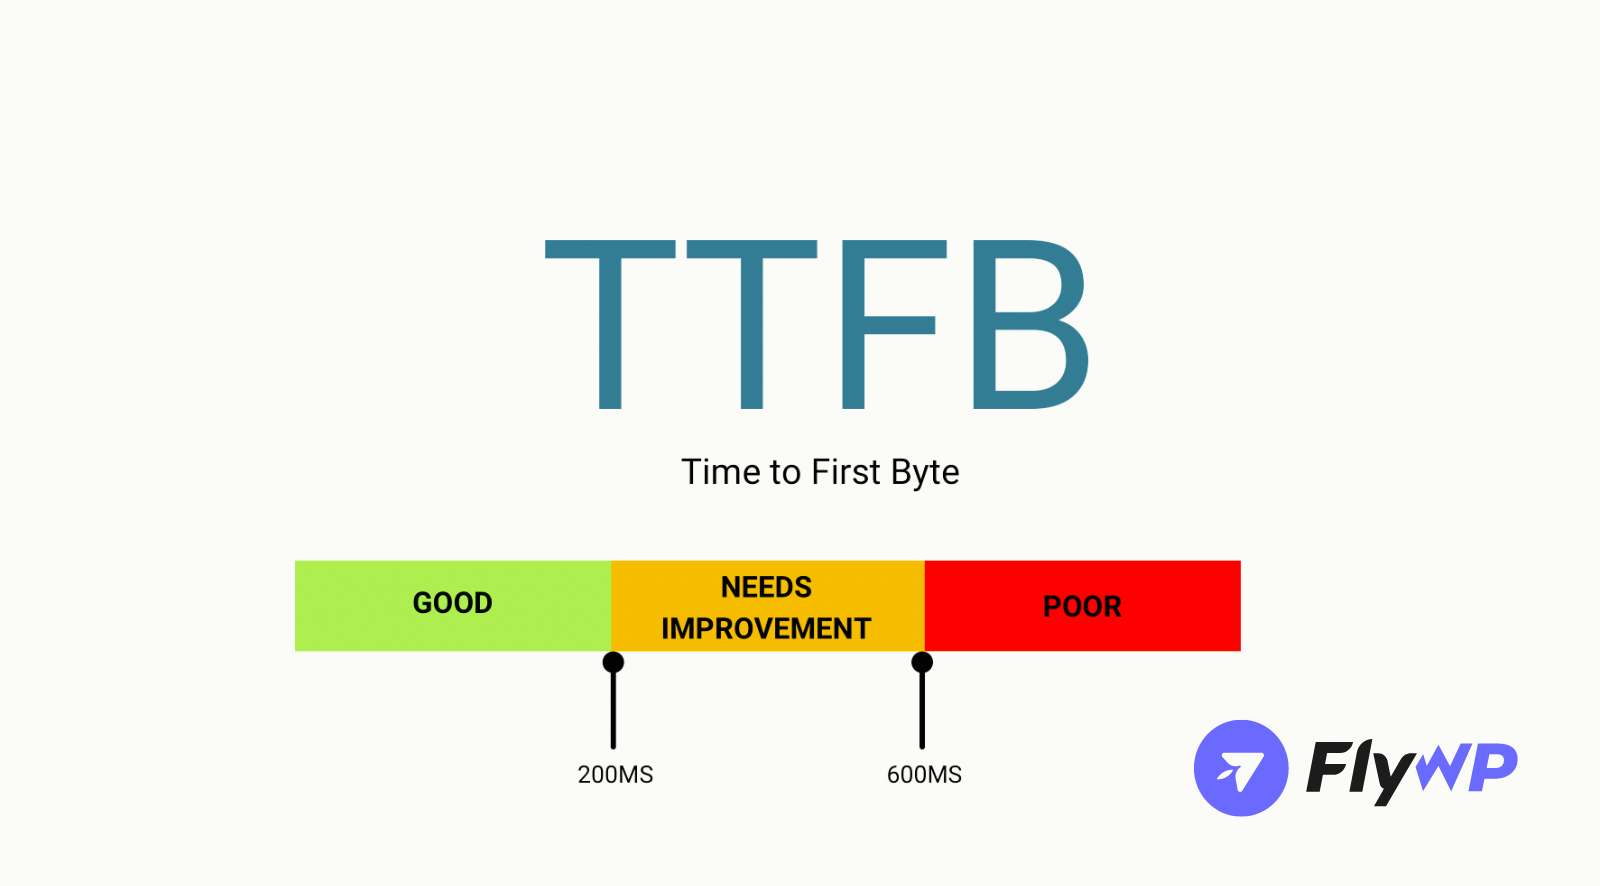
Time to First Byte (TTFB) measures the duration from when a client sends an HTTP request to when the server delivers the first byte of the response. It includes DNS resolution, TCP connection setup, SSL handshake (if applicable), server processing, and initial network transit time. It is a server-centric metric but influenced by network factors, distinguishing it from overall response time.
Related Read: Which Servers Have the Best TTFB?
Example: A news website experiences a TTFB of 1.5 seconds due to a slow database query that generates the front page. Users perceive a significant delay before anything appears, leading to higher bounce rates. Optimizing the query and using a CDN to reduce network transit time drops TTFB to 200ms, improving user experience.
3. Request Rate
The number of incoming requests your server handles per second.
Example: Your blog usually processes 50 requests per second, but after a viral post, it jumps to 500. If your server isn’t scaled for this surge, it could slow or crash, leaving readers staring at a blank screen.
4. Latency Breakdown
The detailed measurement of time spent in different parts of the application process, like database queries or API calls.
Example: Your dashboard loads slowly. Breaking down latency shows 70% of the time is spent waiting for slow database queries. Optimizing those queries cuts load times in half.
5. Transaction Rate
The number of successful transactions (like orders or database commits) completed per second.
Example: During a flash sale, your eCommerce server completes 200 transactions per second. If this drops suddenly to 50, it might indicate database contention or software bugs blocking purchases.
6. Queue Length
The number of requests waiting in line to be processed by your server.
Example: When the queue length rises above 100, new users experience delays. For a ticket booking site, this might mean losing customers who can’t get a seat quickly enough.
7. Cache Hit Ratio
The percentage of requests served from cache instead of hitting the backend server or database.
Example: If your cache hit ratio is 85%, 85 out of every 100 page requests are served instantly from cache. When it drops below 50%, your server gets slammed with repeated database queries, slowing everything down.
Optimization Tips: Improve overall application performance by optimizing database queries and schema, implementing robust caching strategies (e.g., Redis, Memcached). Refactor inefficient application code, and horizontally scale application servers to distribute load.
e. Reliability and Stability
Metrics that track how consistently your server runs and how well it handles errors, critical for maintaining trust and smooth operations.
1. Uptime
Uptime monitoring is the total amount of time a server or service remains operational without interruptions.

Example: Your hosting provider promises 99.9% uptime. That’s about 8.7 hours of downtime per year max. If your eCommerce site goes down for 2 hours during peak season, you lose sales and damage your brand’s reputation.
2. Crash Frequency
The number of times your server or application unexpectedly crashes within a given timeframe.
Example: If your server crashes twice a day, customers might see frequent “site unavailable” errors. This could be due to buggy plugins or resource exhaustion, needing urgent fixes.
3. Restart Time
How long it takes for your server or application to recover and resume normal operations after a crash or restart.
Example: After a crash, your website takes 5 minutes to come back online. That’s too slow during a flash sale, where every second counts to capture buyers.
4. Mean Time To Recovery (MTTR) / Mean Time Between Failures (MTBF)
MTTR (Mean Time To Recovery): The average time it takes to repair a failed system and restore it to full functionality.
MTBF (Mean Time Between Failures): The predicted elapsed time between inherent failures of a system during operation.
Example: Your MTTR for critical database failures is 30 minutes, indicating a quick recovery process once an issue is identified. However, the MTBF for a specific microservice is only 2 days, suggesting a recurring instability issue that needs a root cause analysis and a permanent fix, rather than just quick restarts.
5. Service Availability
The percentage of time a specific service (like your database or API) is accessible and working properly.
Example: Your payment gateway has 99% availability, meaning it’s down for about 7 hours per month. Even short outages during checkout can cause cart abandonment and customer frustration.
6. Log Error Count
The total number of error messages recorded in server or application logs.
Example: A spike in error logs showing “database connection failed” might reveal an overloaded database server, causing transaction failures that need immediate attention.
7. Error Rates
The percentage of failed requests out of total requests indicates how often users experience problems.
Example: If 5% of your API requests return errors, app developers and users will notice disruptions, potentially driving them to competitors.
8. Error Codes / HTTP Status Codes (Specific Types)
The count or rate of specific HTTP status codes returned by the server (e.g., 200 OK, 404 Not Found, 500 Internal Server Error, 503 Service Unavailable). These provide granular insight into the nature of errors.
Example: A sudden spike in 500 Internal Server Error status codes immediately after a new application deployment indicate a critical bug or configuration issue on the server. An increase in 404 Not Found errors might suggest broken links on a website or users attempting to access non-existent pages, which requires content management fixes rather than server troubleshooting.
Optimization Tips: Enhance uptime and availability with high-availability setups (e.g., load balancers, failover clusters), implement robust error handling and logging, and reduce MTTR through automated recovery scripts and well-defined incident response procedures.
Bonus: Server Health Related Metrics (Not Strictly Performance)
These metrics are relevant to server health but focus on security, hardware conditions, or aggregated insights rather than direct performance measurement.
a. Security and Compliance
Metrics that track security events and compliance, protecting your server from attacks that can degrade performance or cause downtime.
1. Failed Login Attempts
The number of times users enter incorrect login credentials often signals brute-force attacks or unauthorized access attempts.
Example: Your WordPress admin panel logs 500 failed login attempts in one hour. This surge could be a hacker trying to guess passwords, overloading your server, and risking a breach.
2. Open Ports
Network ports on your server that accept incoming connections. Open ports can expose vulnerabilities if not properly managed.
Example: Your server has unused ports open, like FTP on port 21. Attackers scan and exploit these to gain unauthorized access, causing service disruptions and draining resources.
3. SSL Certificate Status
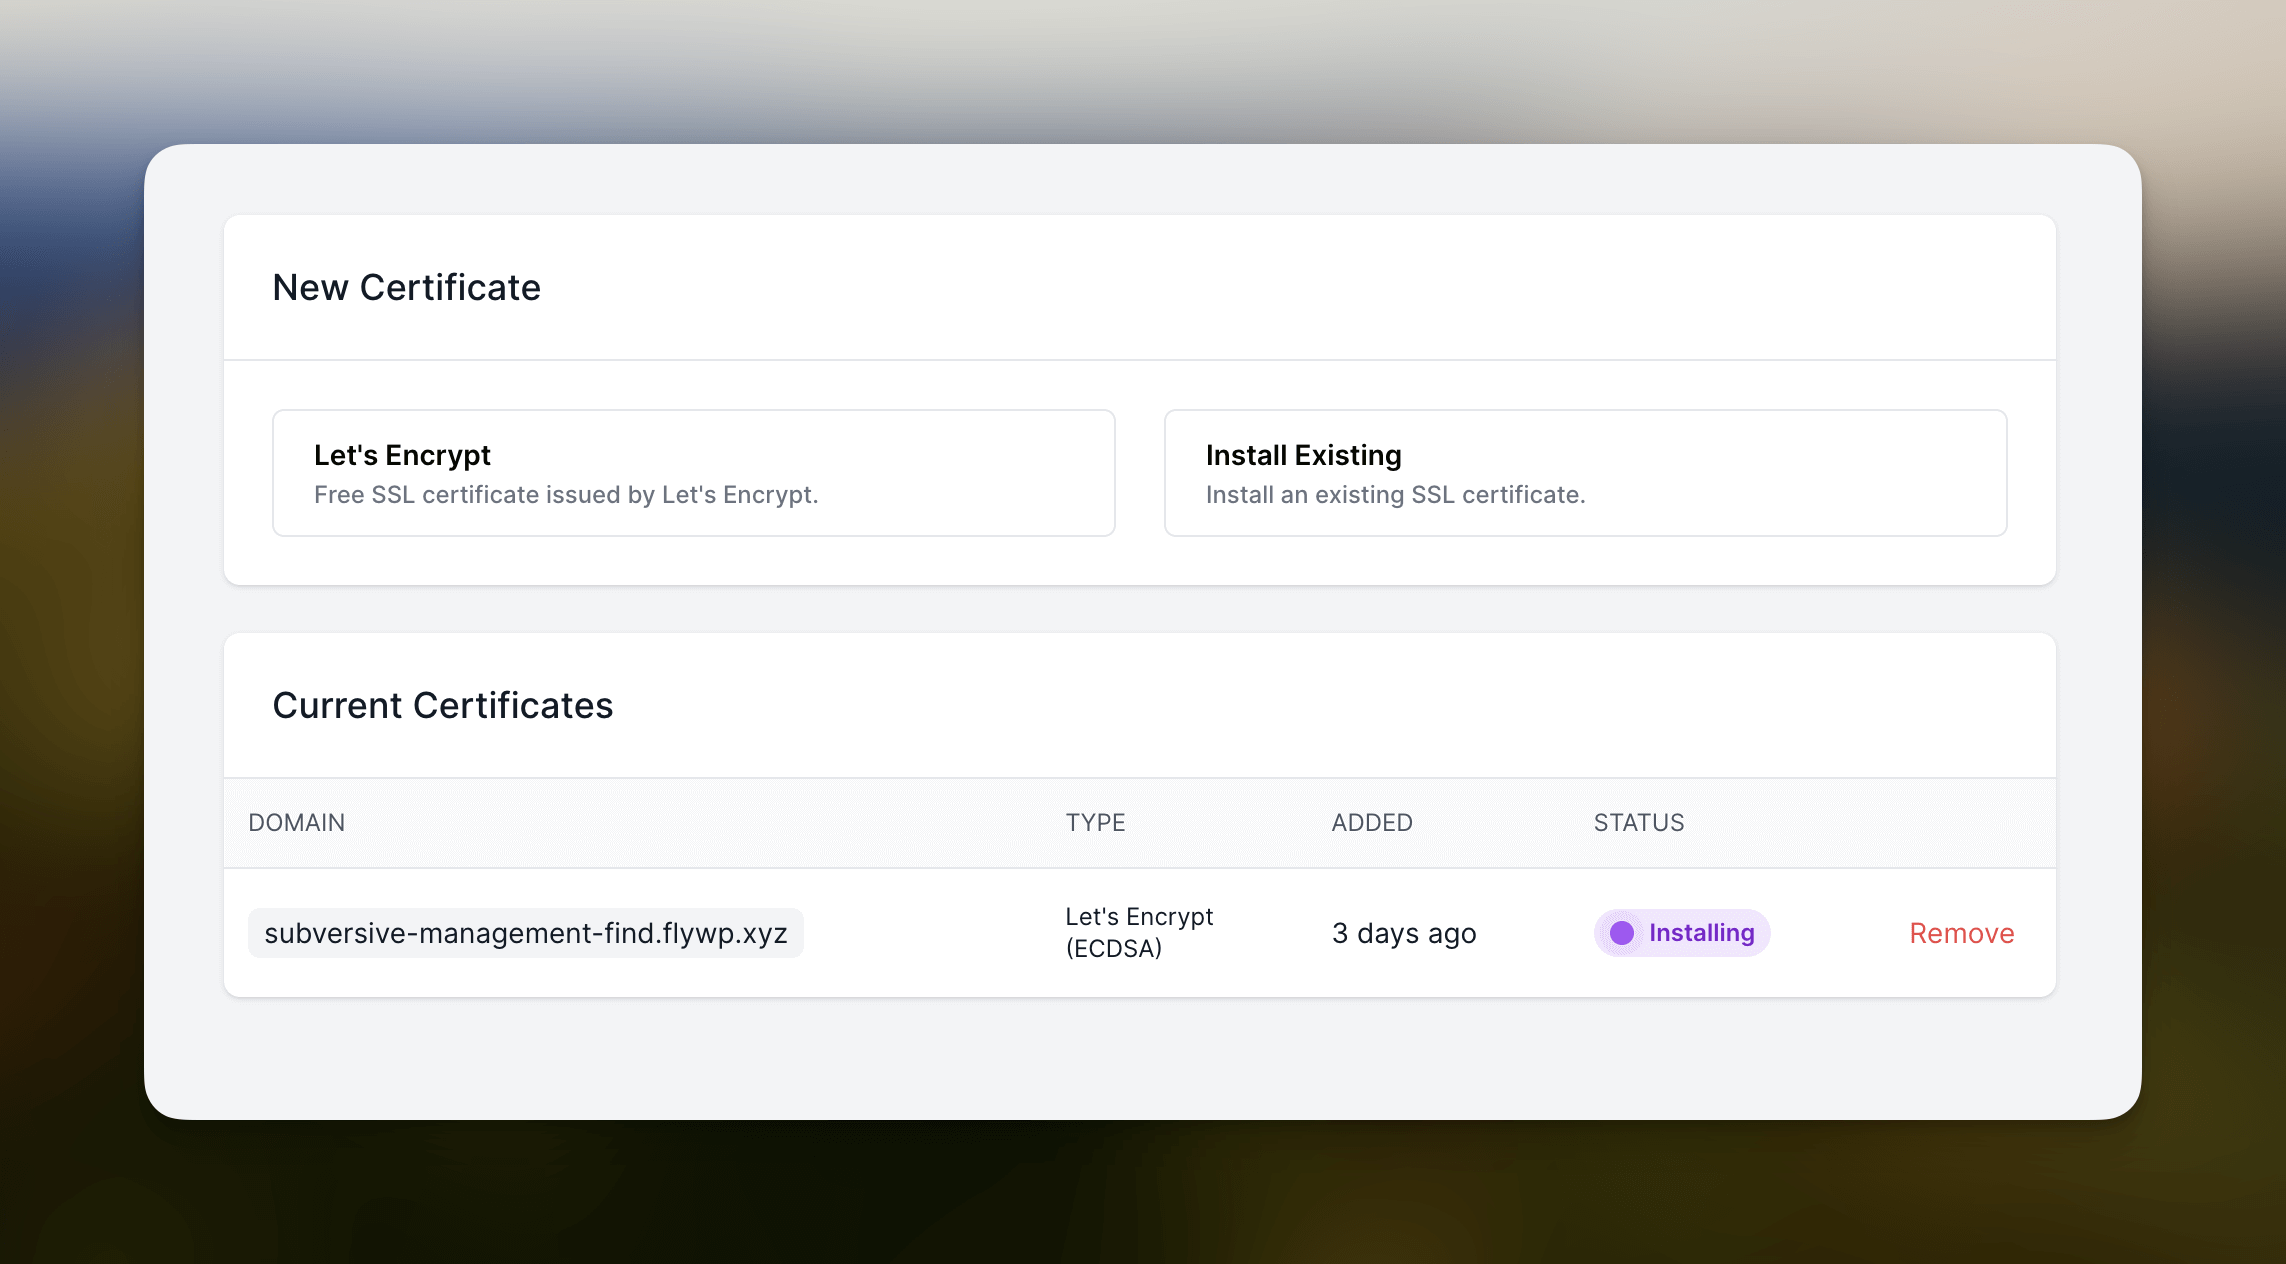
The validity and expiration status of SSL certificates that encrypt data between clients and your server.
Example: An expired SSL certificate leads to browser warnings, driving visitors away, and potentially allowing man-in-the-middle attacks that compromise data integrity.
4. Firewall Rules Hit Count
How often firewall rules are triggered to block or allow traffic based on predefined security policies.
Example: A sudden spike in firewall hits blocking IP addresses from suspicious countries could indicate a Distributed Denial of Service (DDoS) attack trying to overwhelm your server.
Related Article: Best Cloudflare WAF Rules to Protect Your WordPress Site
Security metrics don’t just protect your data, they keep your server running smoothly by preventing attacks that drain resources and cause crashes.
Optimization Tips: Regularly audit open ports and close unused ones. Implement strong password policies and multi-factor authentication (MFA) to prevent failed login attempts. Keep SSL certificates updated to ensure data encryption. Review and fine-tune firewall rules to effectively block malicious traffic without disrupting legitimate users.
b. Environmental Metrics (Physical or Virtual Servers)
Metrics that monitor the physical health of your servers or virtual machines, ensuring hardware conditions don’t degrade and cause performance issues or downtime. These apply primarily to on-premises or bare-metal servers, as cloud providers abstract hardware monitoring.
1. CPU Temperature
The heat level of your CPU cores, usually measured in degrees Celsius or Fahrenheit. Excessive heat can lead to throttling or hardware failure.
Example: Your data center’s server room air conditioning fails, causing CPU temperatures to spike above 90°C. To protect itself, the CPU slows down, making your website sluggish until the cooling is fixed.
2. Power Usage
The amount of electrical power consumed by your server hardware, often measured in watts.
Example: A server experiencing a power surge might consume more electricity, triggering circuit breakers or causing unstable operation that leads to crashes or data corruption.
3. Fan Speed
The rotational speed of cooling fans inside the server, measured in RPM (revolutions per minute). Fans adjust speed to maintain optimal temperatures.
Example: A failing fan runs slower than usual, causing inadequate cooling. The resulting overheating leads to hardware errors and unexpected server shutdowns during peak traffic.
Keeping an eye on environmental metrics helps prevent hardware damage and keeps your servers performing at their best.
Optimization Tips: Ensure adequate cooling and airflow in data centers to maintain optimal CPU temperatures and prevent overheating. Monitor power usage closely for anomalies that could indicate hardware issues or efficiency problems. Implement a regular fan maintenance schedule and replace failing fans promptly to ensure consistent cooling and prevent shutdowns.
c. Composite Metrics and Aggregated Insights
Metrics that combine core performance data to provide overall health indicators, helping you understand user satisfaction and meet service commitments.
1. Apdex Score
Apdex (Application Performance Index) quantifies user satisfaction by categorizing response times into satisfied, tolerating, and frustrated zones, then scoring from 0 (worst) to 1 (best).
Example: For a SaaS dashboard, set Apdex thresholds: satisfied (<500ms), tolerating (500ms–1s), frustrated (>1s). If 80% of requests are <500ms, 15% are 500ms–1s, and 5% are >1s, the Apdex score is 0.875. Use New Relic to track and adjust thresholds based on user feedback.
2. SLI/SLO/SLA Metrics
Definition:
- SLI (Service Level Indicator) measures specific performance aspects like uptime or error rate.
- SLO (Service Level Objective) sets a target for SLIs, such as 99.9% uptime.
- SLA (Service Level Agreement) is the formal contract guaranteeing SLOs with penalties for breaches.
Example: For an eCommerce API, define an SLI as ‘percentage of requests with TTFB <200ms.’ Set an SLO of 99% of requests meeting this. Monitor with Datadog and adjust server capacity if the SLI drops below 99%.
These composite metrics help you translate raw data into meaningful insights that directly impact customer trust and business success.
Optimization Tips: Regularly review and adjust Apdex thresholds to accurately reflect evolving user expectations. Ensure SLIs are precise and measurable, and that SLOs are realistic and align with business goals. Use these metrics not just for reporting, but as triggers for deeper investigation and as feedback loops for continuous improvement in application performance and reliability.
Cloud vs. On-Premises Considerations for Server Performance Metrics
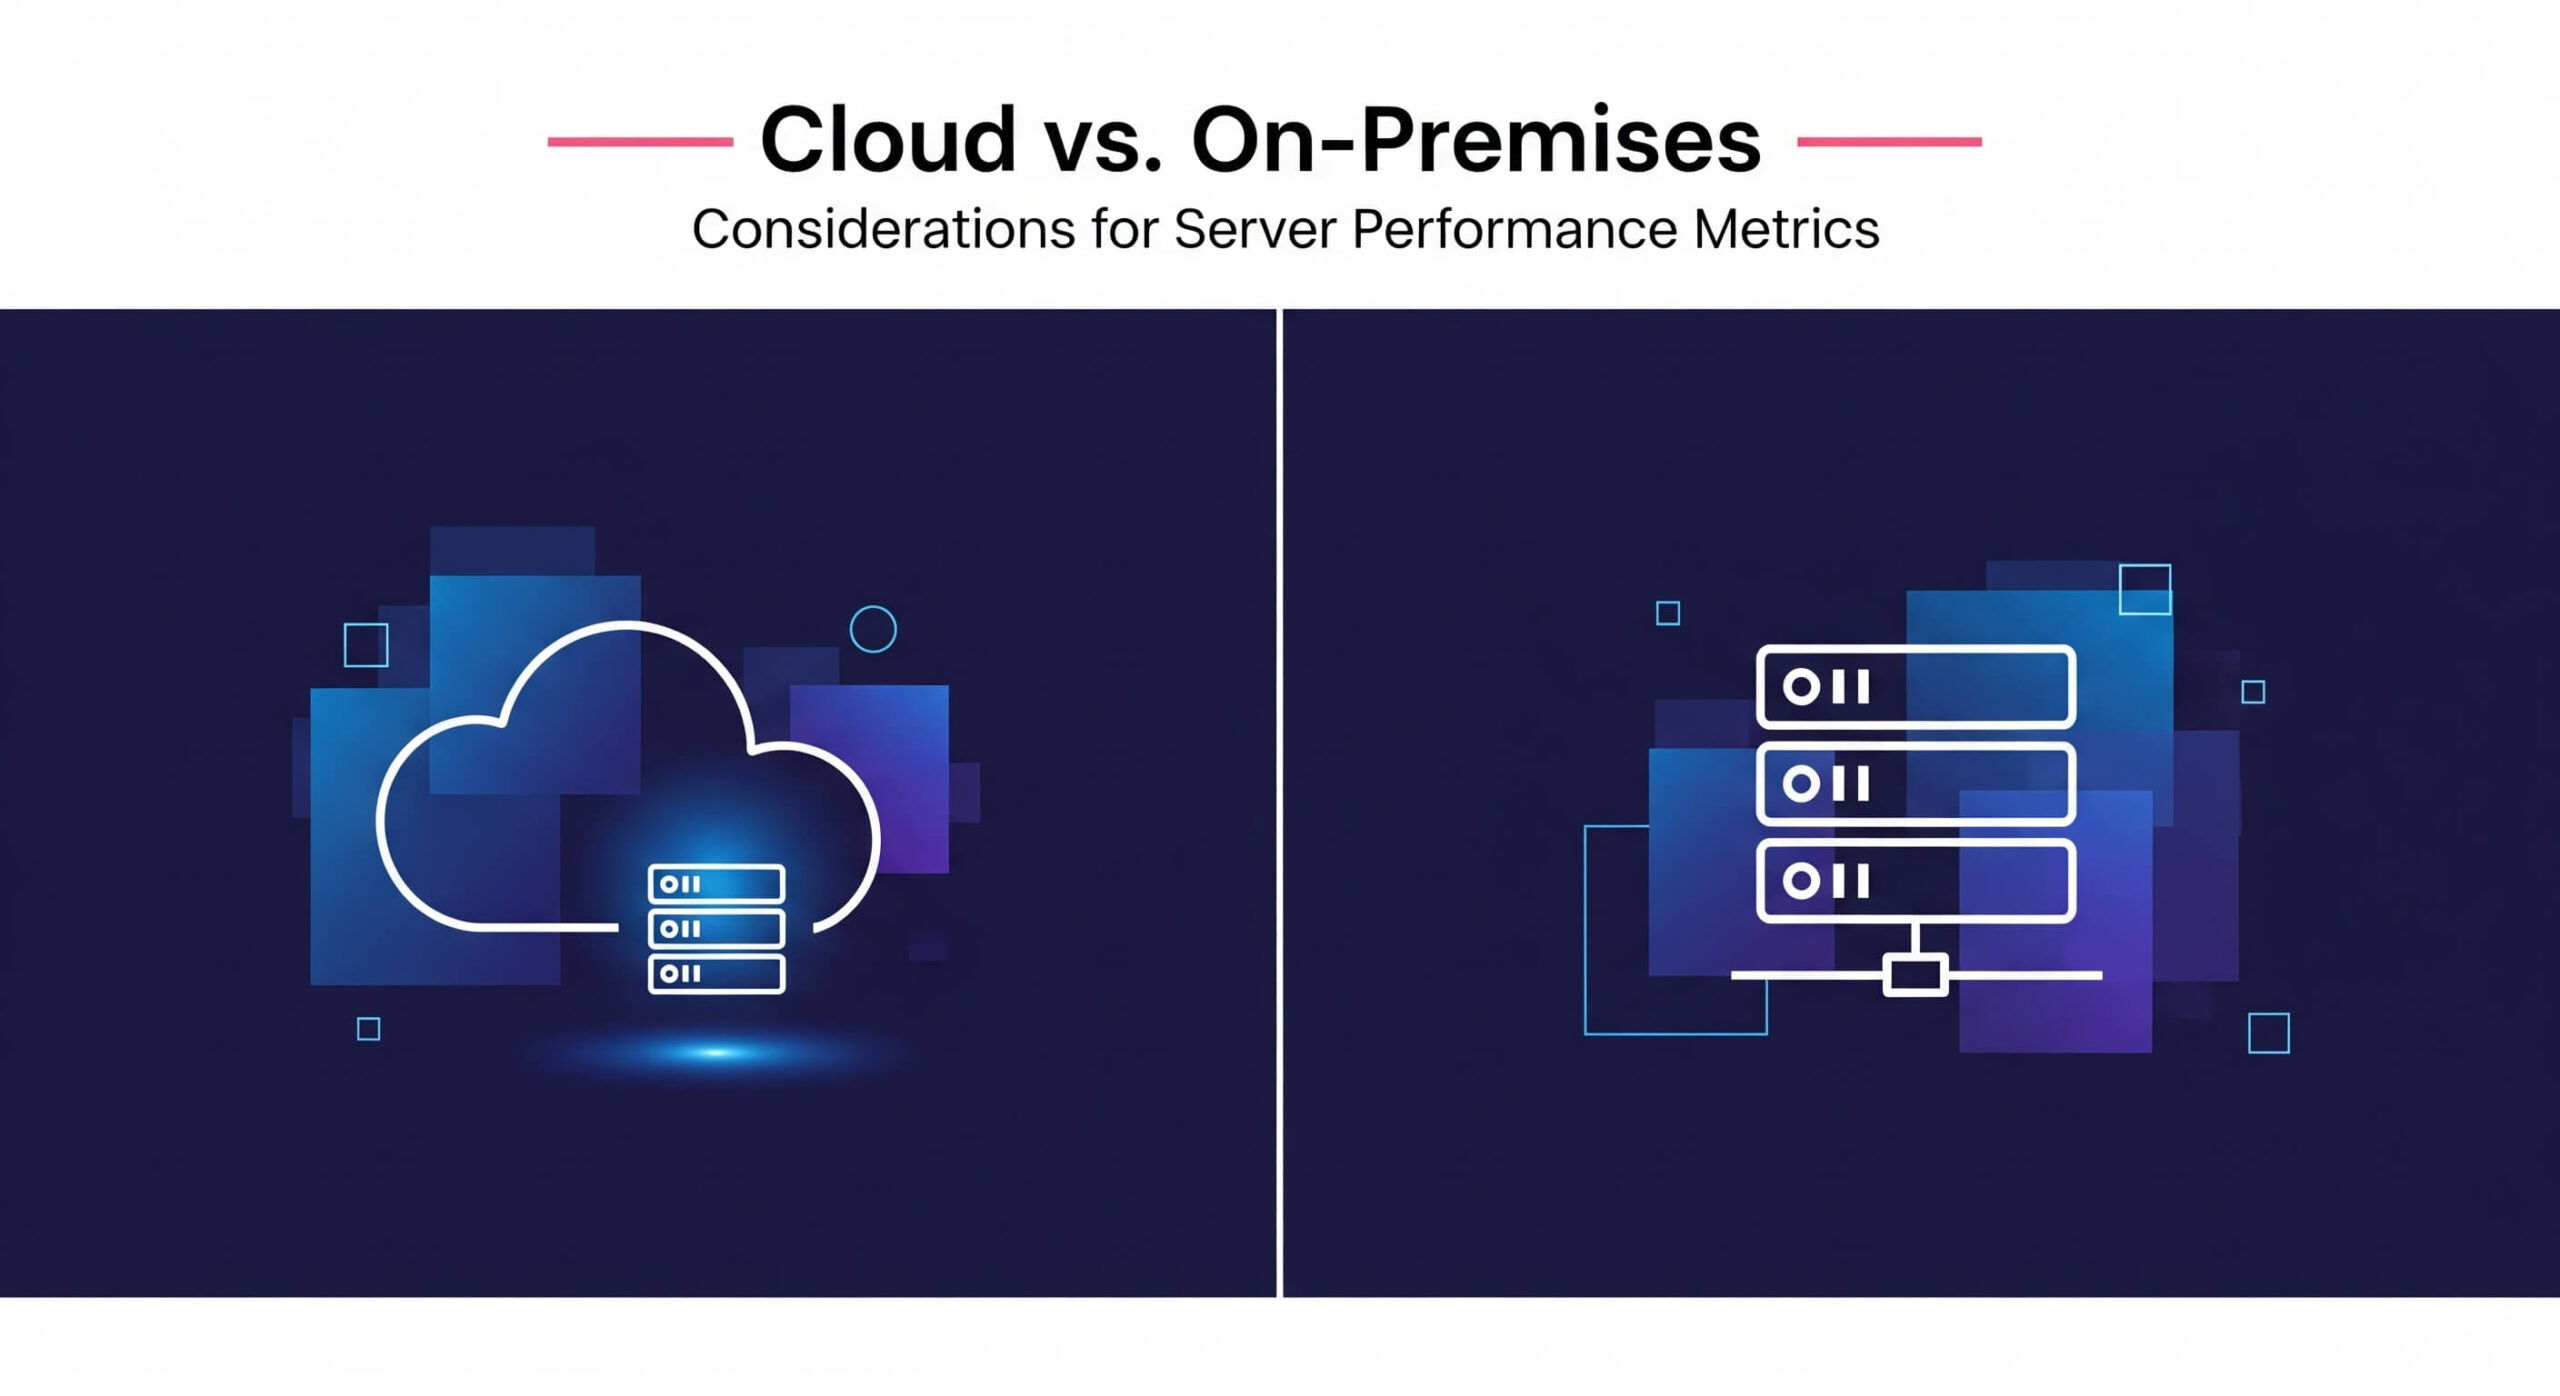
Server performance metrics vary in relevance depending on whether you’re managing an on-premises server or using a cloud-based platform like AWS EC2, Google Cloud, or Azure. Understanding these differences ensures you focus on the right metrics for your environment and avoid wasting effort on irrelevant ones. Below, we outline key distinctions and tools tailored to each setup.
On-Premises Servers
For physical or bare-metal servers hosted in your data center, low-level hardware and environmental metrics are critical to maintaining performance and preventing failures:
Environmental Metrics: Metrics like CPU temperature, fan speed, and power usage are essential to monitor. Overheating CPUs (e.g., exceeding 90°C) can throttle performance or cause shutdowns, while failing fans or power surges risk hardware damage. For example, a server room cooling failure could spike CPU temperatures, slowing your eCommerce site during peak traffic.
Low-Level Compute Metrics: Metrics like context switches and interrupts per second reveal how efficiently the CPU handles tasks and hardware signals. High context switches (e.g., 50,000 per second) on a VPS hosting multiple sites might indicate conflicting workloads, requiring task prioritization or hardware upgrades.
Monitoring Tools: Use sensors or ipmitool for environmental metrics like CPU temperature and fan speed. Tools like vmstat or pidstat track context switches and interrupts. For comprehensive monitoring, deploy Nagios or Zabbix to aggregate hardware and performance data.
Cloud-Based Servers
In fully managed cloud environments (e.g., AWS EC2, Google Cloud, Azure), hardware-level metrics are typically abstracted by the provider, shifting focus to application and network performance, as well as cloud-specific metrics:
Application-Level Metrics: Metrics like Time to First Byte (TTFB), request rate, and cache hit ratio are critical, as they directly impact user experience. For example, a SaaS app on AWS with a TTFB of 1.5 seconds due to slow API responses may lose users unless optimized with caching or database indexing.
Network Metrics: Network throughput and latency are vital due to shared cloud infrastructure. High throughput (e.g., maxing out at 500 Mbps) during a video streaming surge might require a CDN or bandwidth scaling to prevent buffering.
Cloud-Specific Metrics: Monitor metrics unique to cloud environments, such as auto-scaling group health (e.g., the number of healthy instances in an AWS Auto Scaling group) or API gateway latency (e.g., delays in AWS API Gateway responses). For instance, if an auto-scaling group fails to add instances during a traffic spike, your eCommerce site might crash, even if CPU usage is low.
Monitoring Tools: Use cloud-native tools like AWS CloudWatch for disk IOPS, network throughput, and auto-scaling metrics, or Google Cloud Monitoring for container orchestration health (e.g., Kubernetes pod status). VPC Flow Logs in AWS can track network performance, while Application Performance Monitoring (APM) tools like New Relic or Datadog provide deep insights into TTFB and request rates.
Server Performance Metrics Cheat Sheet (With Benchmarks)
Too many metrics and no clue what “good” looks like? We’ve all been there. That’s why this cheat sheet cuts through the noise. Here, you’ll find the ideal range for each critical server metric, what to watch out for, and what to do when things go sideways. Use it as your go-to reference whether you’re debugging a sluggish site or planning your next server upgrade. Print it. Bookmark it. Stick it on your wall if you must.
| Metric | Ideal Range | Warning Signs | Action Steps |
|---|---|---|---|
| CPU Usage | < 70% average | > 90% sustained | Optimize app, offload tasks |
| Memory Usage | < 75% | Nearing 100% | Use swap, upgrade RAM, fix leaks |
| Disk I/O Latency | < 1ms (SSD) | > 10ms | Upgrade to faster drives, clean I/O backlog |
| TTFB | < 200ms | > 500ms | CDN, caching, faster backend |
| Uptime | 99.9%+ | Frequent downtime | Fix crash loops, monitor services |
| Error Rate | < 1% | Spikes in 4xx/5xx | Debug errors, improve app logic |
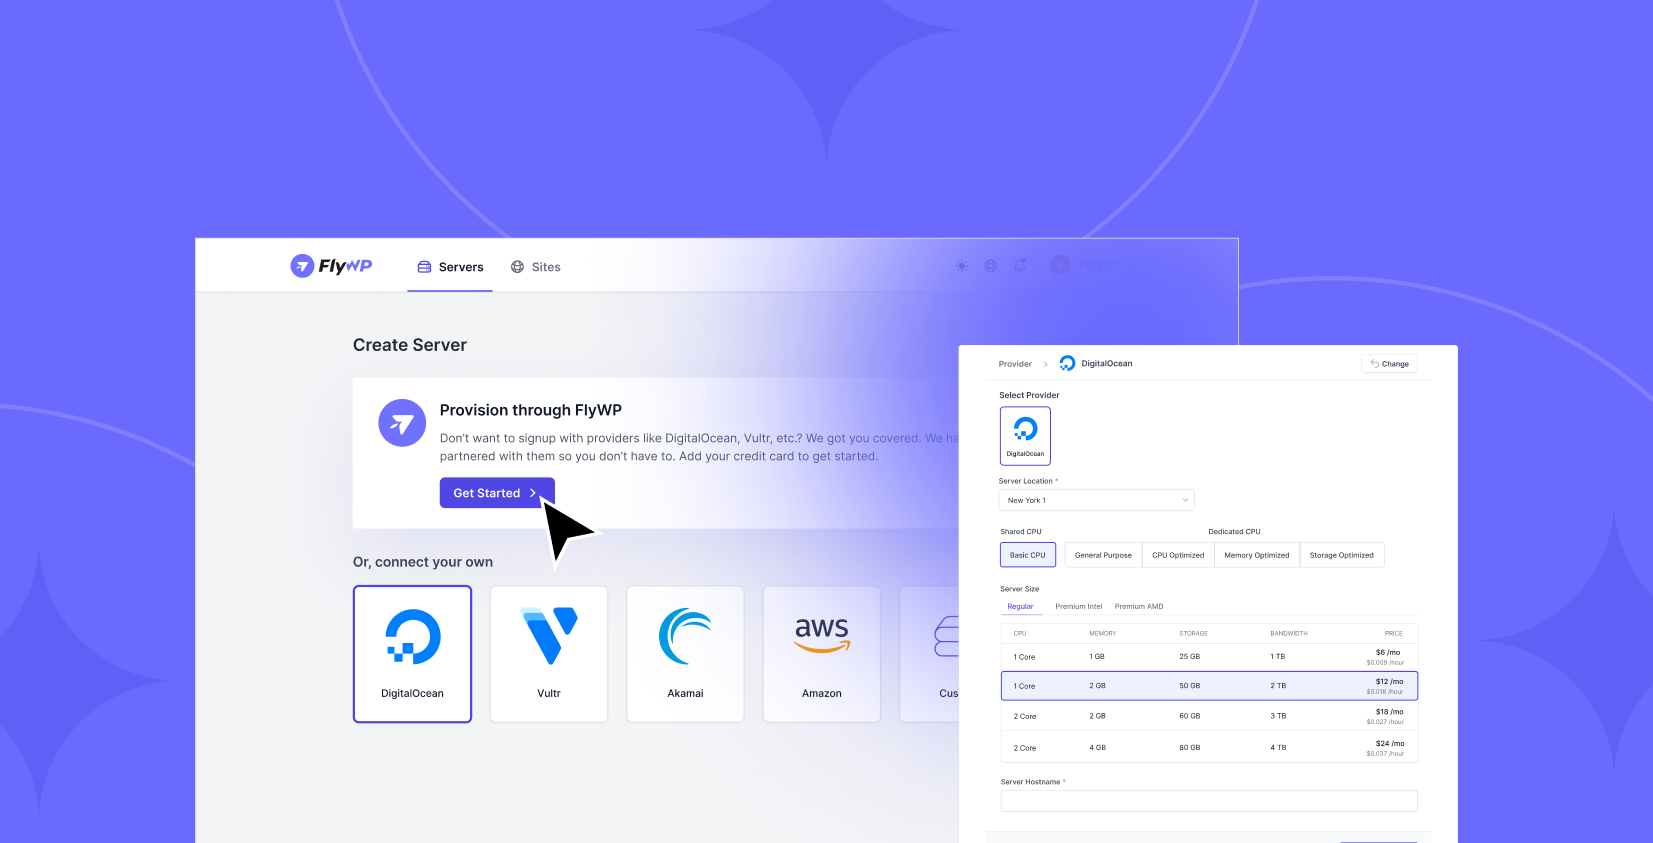
FlyWP: Your WordPress Ally for Server Performance Monitoring
FlyWP is a cloud-based server management platform tailored for WordPress. It’s designed to simplify monitoring and optimize performance across your VPS or cloud servers (e.g., DigitalOcean, AWS EC2, Google Cloud, Vultr, Hetzner, or other servers). FlyWP’s intuitive dashboard and powerful tools make it easy to track the server performance metrics that matter most. Let’s explore how FlyWP aligns with the server performance metrics and why it’s a blessing for WordPress users.
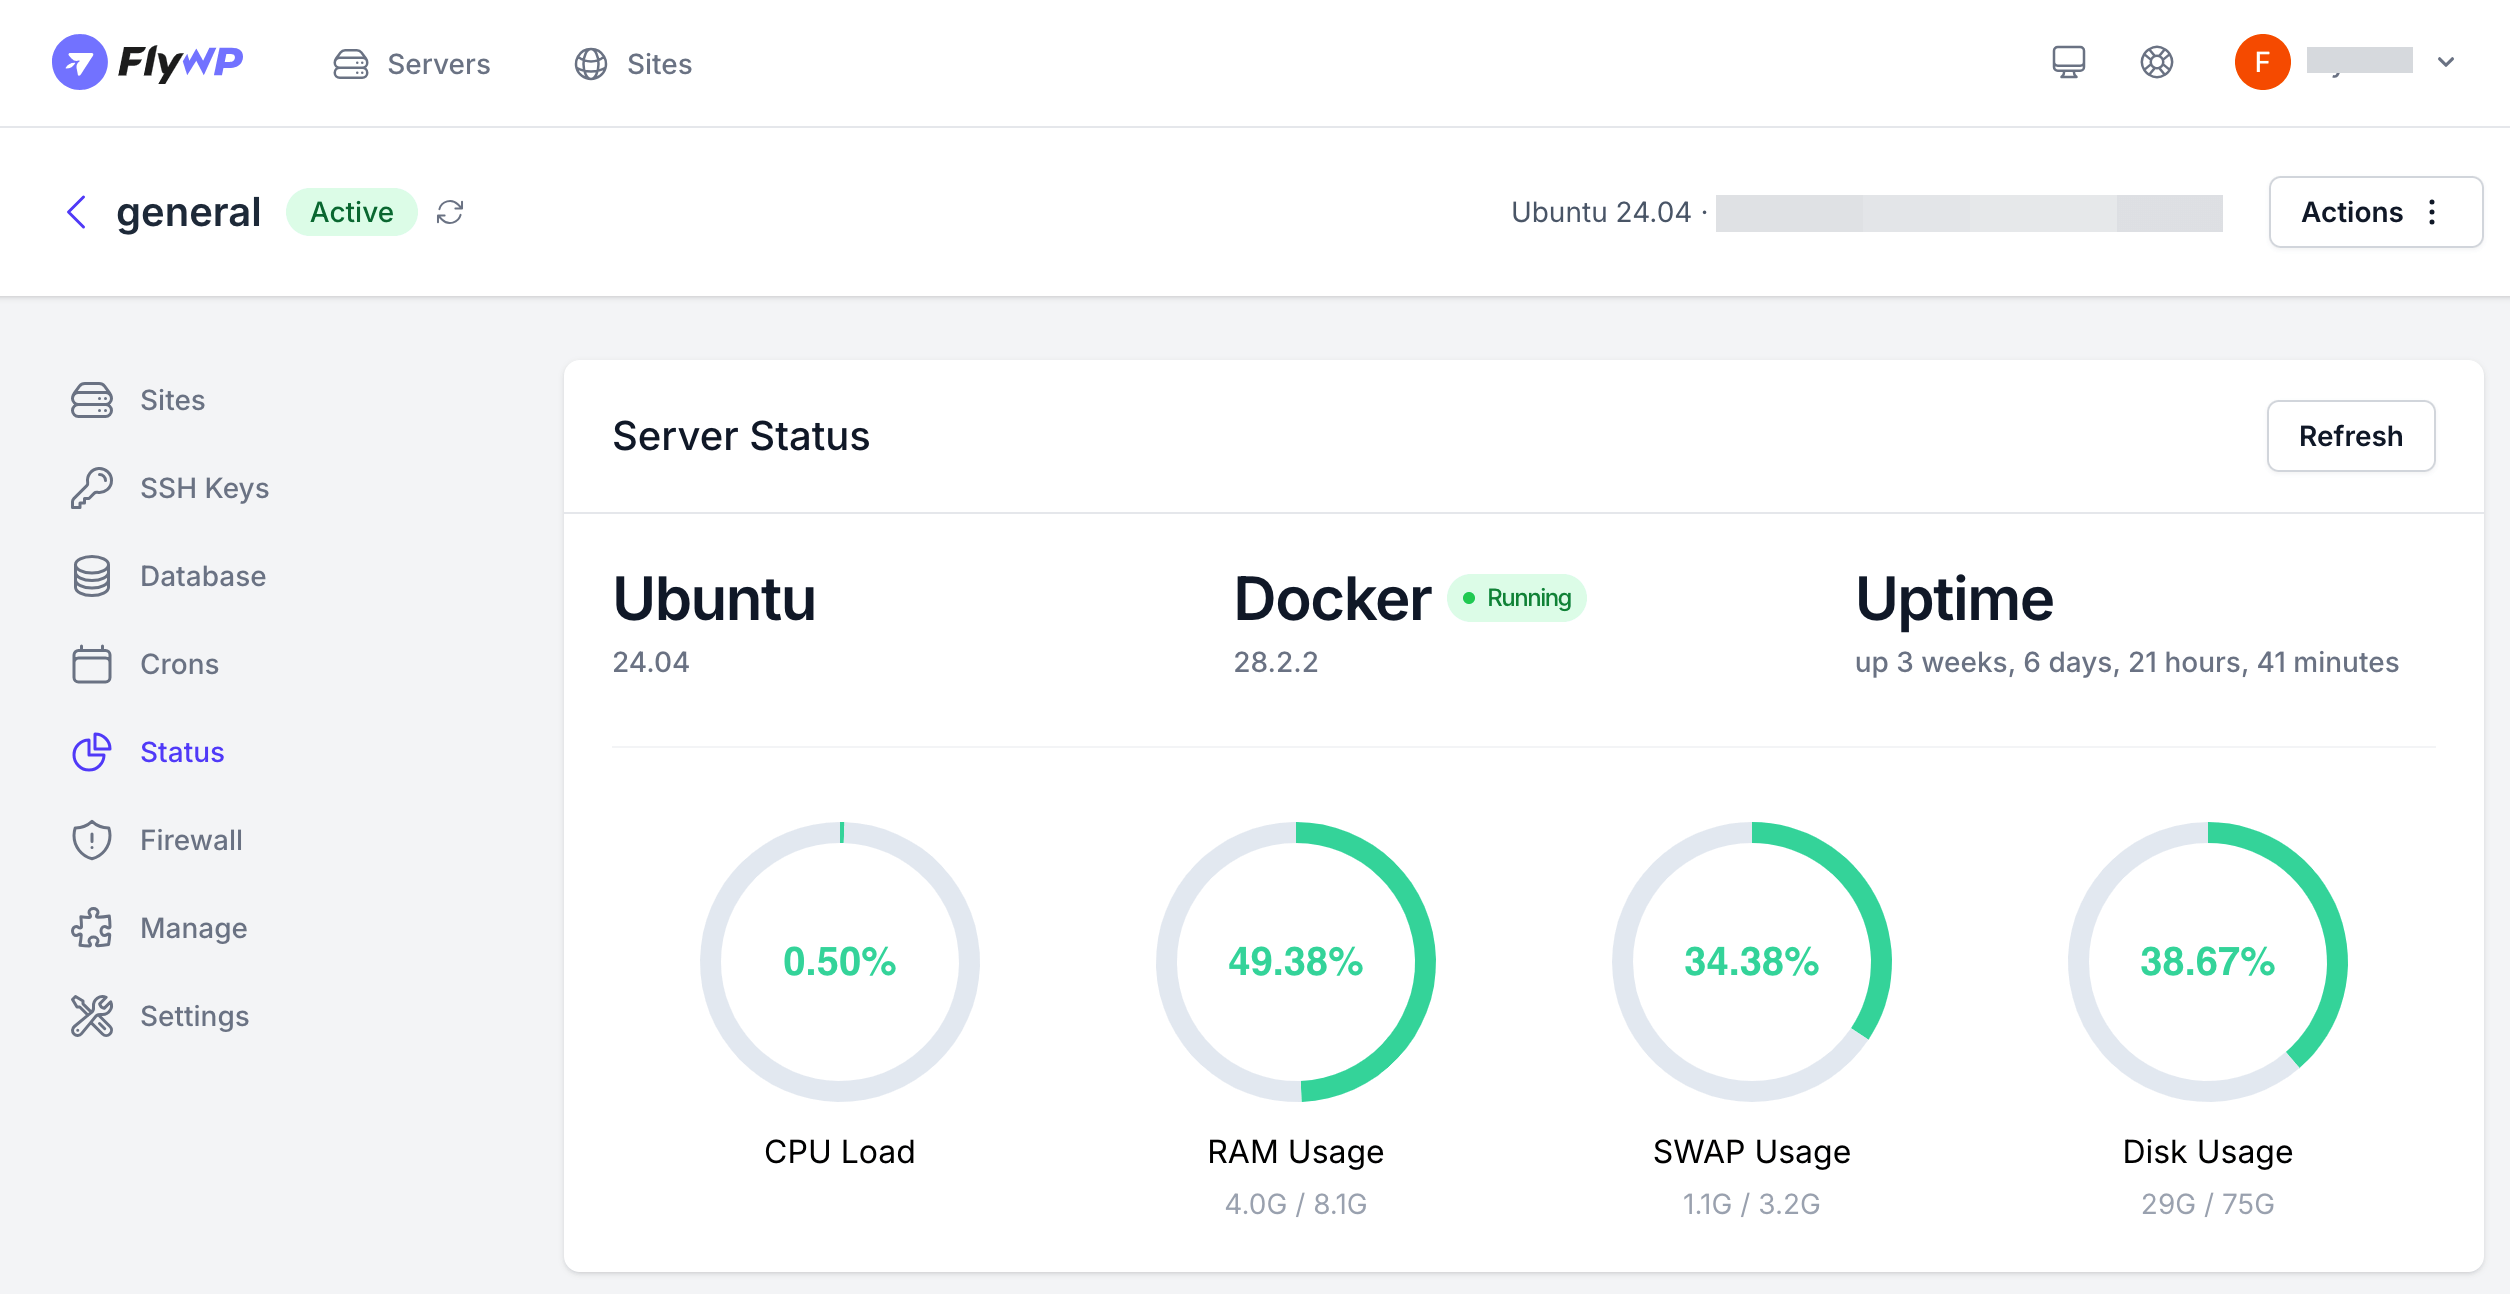
1. Monitoring Compute Performance with FlyWP
FlyWP’s Server Status section provides real-time insights into CPU Usage, Memory Usage (RAM), Swap Usage, and Disk Space Usage, helping you spot resource bottlenecks before they slow your site. For example, if your WooCommerce store spikes to 95% CPU usage during a sale, FlyWP highlights this in red, alerting you to optimize code or upgrade your server’s CPU cores. It also lets you tweak PHP memory settings and PHP-FPM configurations, so you can fine-tune memory usage for larger sites, preventing swap-related slowdowns.
2. Tracking Storage Performance
FlyWP supports high-performance storage configurations, ensuring your WordPress files and databases don’t hit capacity limits. It works well with fast storage solutions (e.g., NVMe SSDs on supported providers like Hetzner), which helps maintain low Disk Latency and high IOPS, critical for database-heavy sites like membership platforms.
FlyWP’s daily/hourly backups to cloud storage (e.g., Amazon S3, Google Cloud) prevent Disk Space Usage issues by offloading backups, while its backup error handling provides clear logs to troubleshoot failed writes, reducing Disk I/O bottlenecks.
3. Optimizing Network Performance
DNS and cache management, Cloudflare integration, and choice of Nginx or OpenLiteSpeed stacks help FlyWP in supporting Network Throughput and Network Latency optimization. These reduce latency for global users by serving cached content closer to visitors, minimizing Packet Loss and Error Packets. Its FastCGI Cache and Full Page Caching reduce network load, boosting Connection Rate capacity for high-traffic events.
4. Enhancing Application Performance
FlyWP shines in application performance, directly supporting metrics like Response Time, Time to First Byte (TTFB), Request Rate, and Cache Hit Ratio. Its Redis Object Cache, PHP OPcache, and LiteSpeed Cache increase performance, reducing TTFB and improving Cache Hit Ratio. Its WP Config Editor lets you optimize PHP settings to reduce Latency Breakdown in database queries, while its WordPress CLI Support streamlines command-line tasks for developers.
5. Ensuring Reliability and Stability
FlyWP’s Website Uptime Monitor add-on checks your site every one minute, tracking Uptime, Service Availability, and Error Rates with detailed Error Codes (e.g., 500, 503) to pinpoint issues like database connection failures. You get real-time alerts via email, minimizing Mean Time to Recovery (MTTR). It also reduces Crash Frequency, while log access helps diagnose Log Error Count spikes.
While not core performance metrics, FlyWP’s security features indirectly enhance performance. It’s 7G Firewall protect sites from DDoS attacks and bots that could spike CPU Usage or Error Rates. These features keep your server focused on performance, not fighting threats.
Take Control of Your Server’s Performance
Server performance metrics aren’t just numbers; they’re your roadmap to a faster, more reliable, and user-friendly WordPress site. By keeping tabs on CPU Usage, Disk Latency, Network Throughput, Response Time, Uptime, and more, you can spot issues before they frustrate users or affect your SEO.
Whether it’s a WooCommerce store struggling under a Black Friday rush or a blog slowing after a viral post, these metrics tell you what’s wrong and how to fix it. Tools like FlyWP make this easier than ever, offering a centralized dashboard to monitor compute, storage, network, application, and reliability metrics, plus optimizations like Redis caching and Cloudflare integration to keep your site up and running.
Don’t wait for a crash to start paying attention. Use the cheat sheet to benchmark your server, explore FlyWP’s 14-day free trial to streamline monitoring, and dive into your dashboard today. A well-monitored server means happier users, better conversions, and fewer late-night fire drills. Take control now – your site (and your users) will thank you.