A slow server can bleed users, revenue, and reputation in seconds. In fact, the 2024 EMA research found that the average cost of unplanned IT downtime has soared to over $14,000 per minute. That’s serious money slipping through your fingers.
But here’s the good news: You don’t have to wait for disaster to strike. With the right monitoring strategy, you’ll catch issues early and fix them fast—before they ever impact your users. This guide covers everything you need to know about monitoring server performance, including how to pick the best tools, understand the data, and fix common server issues.
Why Monitoring Server Performance Is Important
Downtime costs money. Speed matters. Every second your server lags is a customer lost, a page bounce, or a frustrated visitor shouting at their screen. Think of server monitoring as a health check-up. Would you ignore chest pain until the ambulance arrives? No. Then don’t ignore your server’s warning signs. Here’s why you can’t afford to skip monitoring:
- Stop Downtime Before It Happens: Catch abnormalities early and sidestep costly outages.
- Keep Users Happy: Fast servers mean happy users who stick around and come back.
- Save Money: Optimize resources to avoid wasting cash on over-provisioned infrastructure.
- Boost Security: Detect unusual spikes that could signal attacks or malware.
- Plan Smarter: Use historical data to scale your infrastructure ahead of demand.
Regular monitoring is your best defense against surprise crashes and unexpected slowdowns.
What to Monitor: Key Server Performance Metrics You Can’t Ignore

Tracking the right metrics is your first step toward a healthy server. Let’s break them down with what to watch, why it matters, and quick troubleshooting tips.
1. CPU Usage: The percentage of time your CPU cores are active and processing instructions. High CPU usage often indicates that a process or application is consuming excessive resources, leading to slowdowns or unresponsiveness.
- Ideal Range: Typically, consistent usage above 80% (for extended periods) or sudden, sustained spikes are red flags.
- Common Causes of High CPU: Inefficient application code (e.g., infinite loops, unoptimized algorithms), heavy traffic, runaway processes, complex database queries, or even malware.
- Immediate Troubleshooting: Use
top(Linux) or Task Manager (Windows) to identify the highest CPU-consuming processes.
2. Memory Utilization (RAM): The amount of physical RAM currently being used by the operating system and running applications. When RAM runs out, the server starts using disk space as “virtual memory” (swapping), which significantly slows and severely degrades performance. This is often the first bottleneck noticed.
- Ideal Range: Consistently above 85-90% memory usage is a critical warning. High “swap” usage (e.g., >0KB for prolonged periods on an active server) is also a concern.
- Common Causes: Memory leaks in applications, misconfigured caches, insufficient RAM for current workloads, or too many concurrent processes.
- Immediate Troubleshooting: Identify processes consuming the most RAM using
free -horhtop(Linux), or Task Manager (Windows).
3. Disk I/O (Input/Output): The rate at which your server reads and writes data to and from its storage devices (hard drives, SSDs). Measured in operations per second (IOPS) or throughput (MB/s). Slow disk I/O can bottleneck any application that frequently accesses data, especially databases, file servers, or applications with heavy logging.
- Ideal Range: Highly dependent on disk type and workload. Look for consistently high I/O wait time (CPU waiting for disk), or high utilization of the disk (e.g.,
awaitiniostaton Linux). - Common Causes: Slow storage media (traditional HDDs vs. SSDs/NVMe), unoptimized database queries, excessive logging, or high read/write demands from applications.
- Immediate Troubleshooting: Use
iostat(Linux) or Resource Monitor (Windows) to identify disk activity.
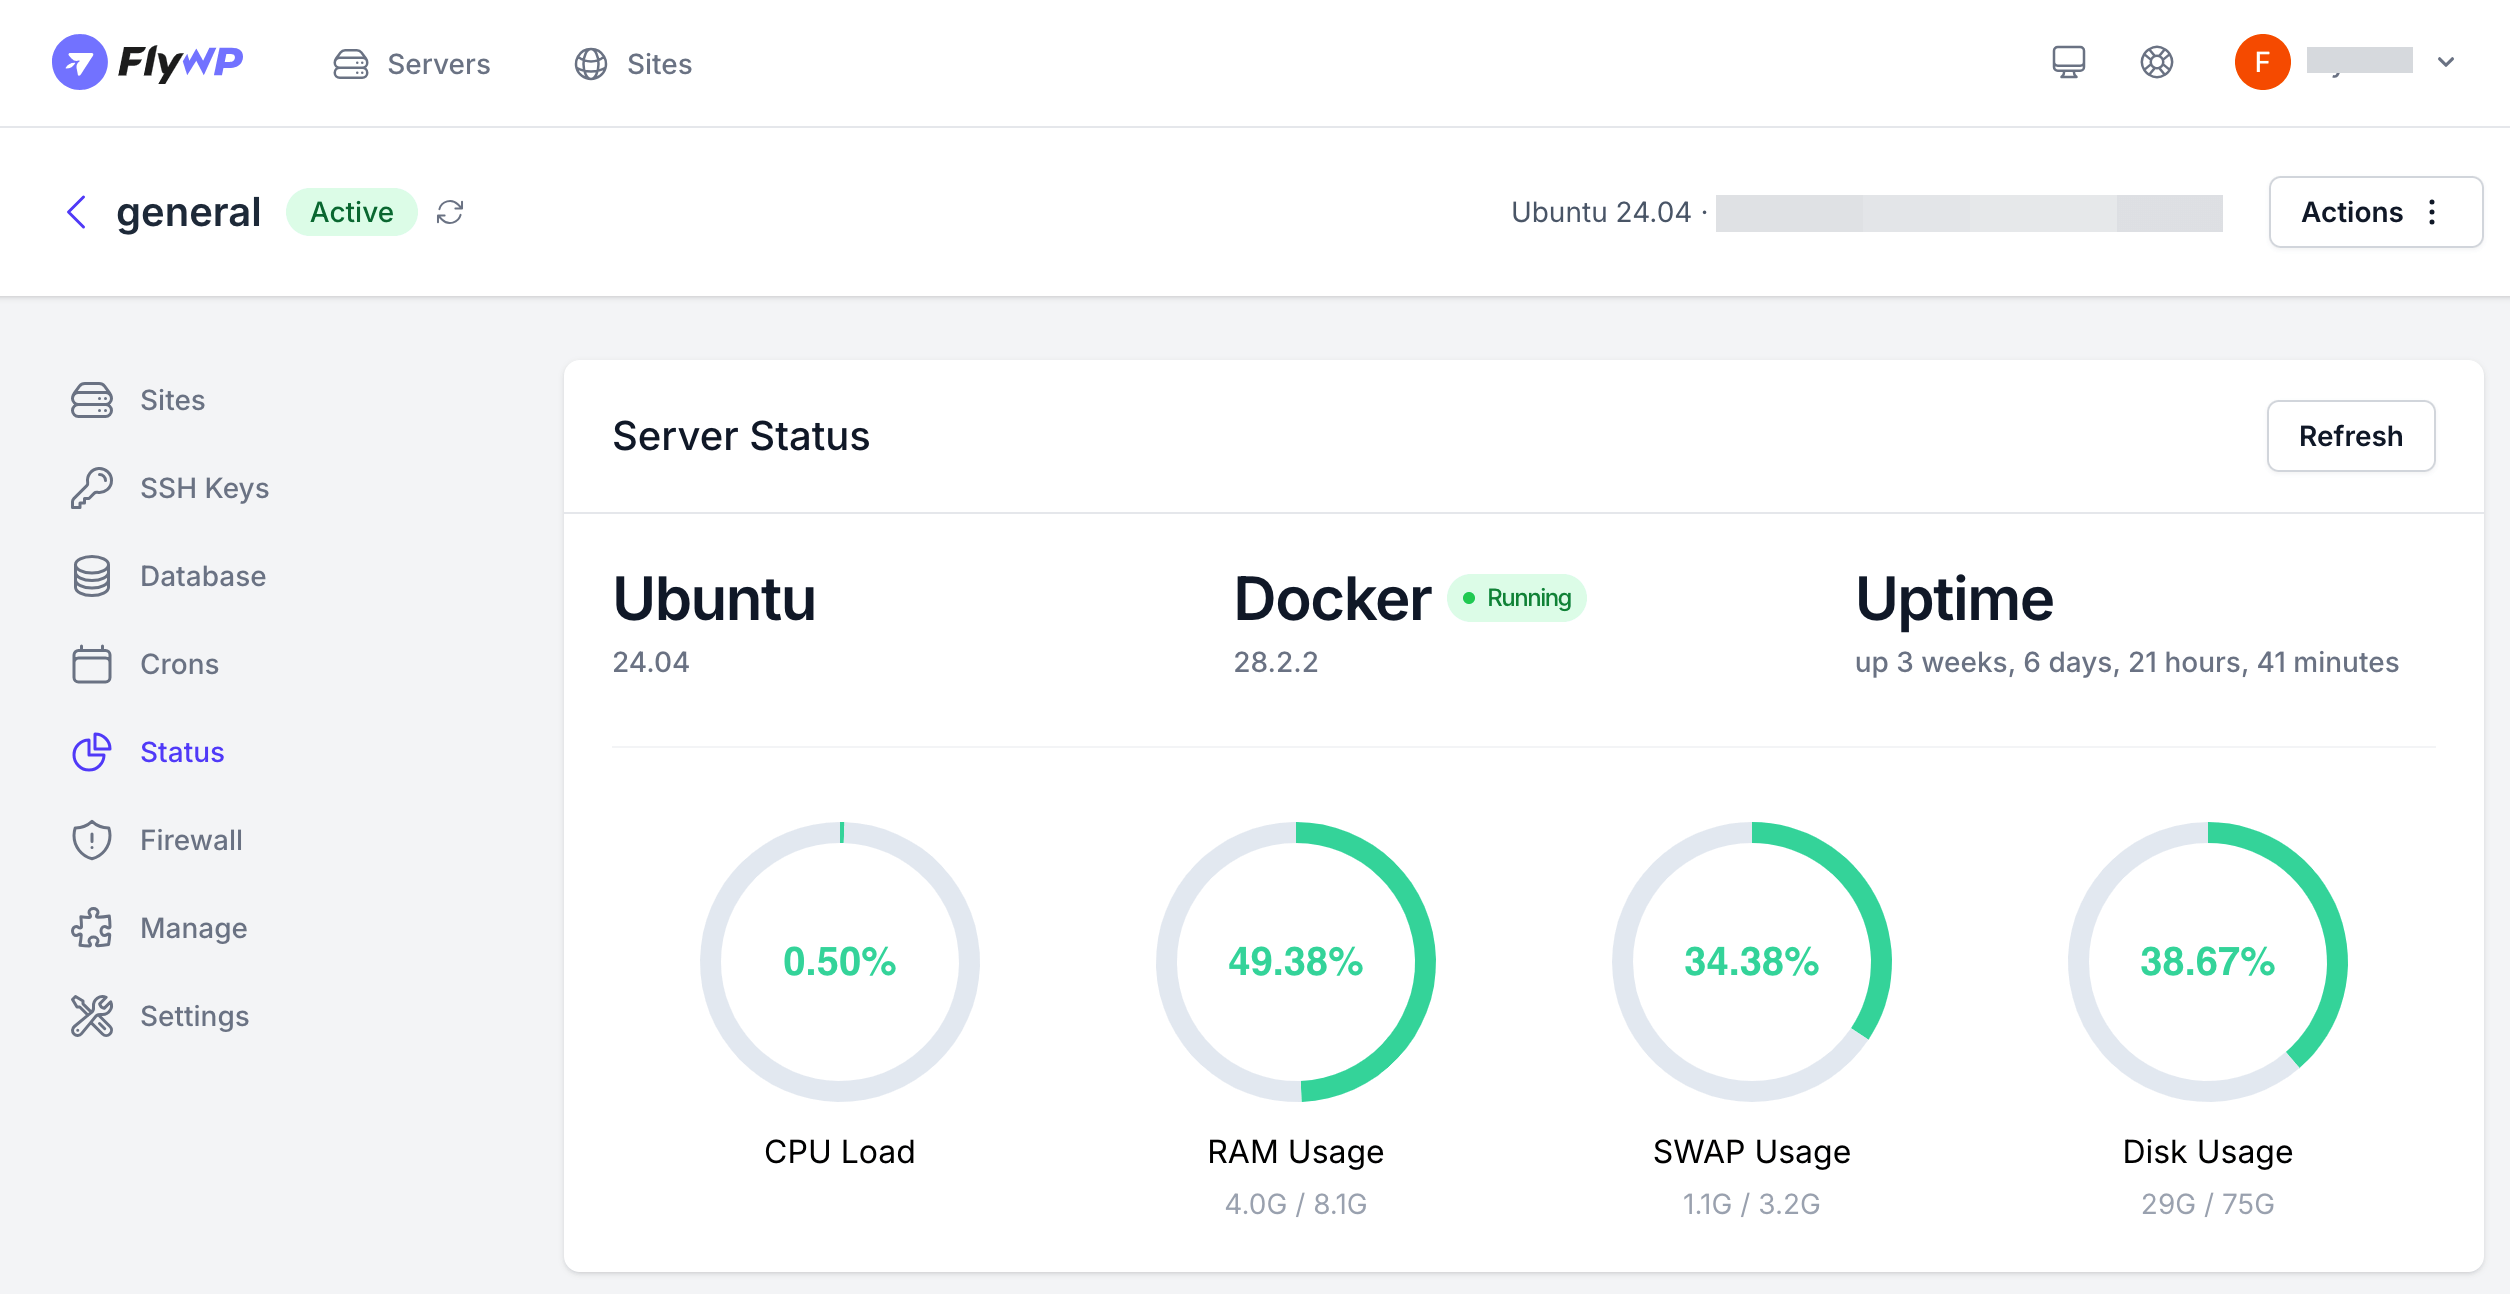
4. Disk Usage/Storage Capacity: The total amount of storage space used on your server’s disks. Running out of disk space can lead to critical failures, prevent applications from writing logs or temporary files, and cause the OS to malfunction.
- Ideal Range: Set alerts when usage exceeds 80-85%. Aim to keep at least 15-20% free for operational overhead.
- Common Causes: Accumulated logs, temporary files, large data sets, backups, or uninstalled applications.
- Immediate Troubleshooting: Use
df -h(Linux) or File Explorer (Windows) to check partition usage.
5. Network Throughput/Traffic: The amount of data being transferred to and from your server over the network. Measured in bits per second (bps) or bytes per second (Bps). High network traffic, packet loss, or high latency can indicate network bottlenecks, DDoS attacks, or inefficient data transfer, affecting user experience.
- Ideal Range: Varies wildly by server role. Monitor for saturation (e.g., consistently hitting close to your network interface’s maximum bandwidth) or unusual spikes/drops.
- Common Causes: High user traffic, large file transfers, DDoS attacks, misconfigured network devices, or inefficient application communication.
- Immediate Troubleshooting: Use
netstatornethogs(Linux) or Resource Monitor (Windows) to see network connections and usage.
6. Uptime: The continuous duration your server has been running without interruption or reboot. A basic but vital indicator of stability. Frequent downtime indicates underlying issues.
- Ideal Range: Aim for as close to 100% as possible. Any unexpected reboots are a critical alert.
- Common Causes: Hardware failure, OS crashes, power outages, critical app failures, attacks, human error, and extreme resource exhaustion.
- Immediate Troubleshooting: Check server status, review recent changes, inspect boot/application logs, check monitoring history, and perform a controlled reboot if needed.
How to Monitor Server Performance (Before It Slows You Down)
Effective monitoring involves tracking a comprehensive set of metrics, employing specialized tools, analyzing data, and taking proactive steps to optimize performance. Below is a detailed guide on how to monitor server performance, tailored to provide actionable insights for system administrators, developers, and WordPress site managers.
1. Understand Key Server Performance Metrics

To effectively monitor server performance, you need to focus on metrics that provide a holistic view of the server’s health and capacity. These metrics are critical for identifying bottlenecks and ensuring optimal performance, especially for WordPress environments. We’ve discussed the key server performance metrics in the previous section. You can also give a deep dive into the essential server performance metrics that website administrators must track to maintain peak server efficiency.
2. Select the Right Monitoring Tools
A robust monitoring setup combines system-level tools, specialized software, and WordPress-specific solutions. Here’s a breakdown of tools to use, with some referenced in the article:
System-Level Tools:
| Tool Name | Purpose | Key Features | WordPress Relevance |
|---|---|---|---|
top | Real-time resource monitoring | CPU, memory, and process stats via CLI | Diagnose high CPU or memory on Linux-based WordPress servers |
htop | Enhanced system monitor | Interactive UI with sorting/filtering | Quickly find memory-hungry plugins or services |
vmstat | Virtual memory stats | Swap, cache, and CPU behavior | Detect memory leaks from WordPress themes/plugins |
iostat | Disk I/O performance tracking | Disk throughput, IOPS, and wait times | Identify bottlenecks affecting MySQL and media storage |
iotop | Real-time I/O usage per process | Per-process disk activity | Pinpoint plugins/scripts causing disk thrashing |
netstat / ss | Network socket and port analysis | Open ports, connections, protocol info | Monitor web server traffic and detect slow connections |
dmesg | Kernel ring buffer logs | Hardware error messages, driver issues | Detect hardware failures affecting uptime |
Server Monitoring Platforms:
| Tool Name | Purpose | Key Features | Relevance to WordPress/Server Monitoring |
|---|---|---|---|
| New Relic | Application + infrastructure monitoring | TTFB, PHP tracing, DB insights | Deep performance insights on WordPress requests and plugin bottlenecks |
| Datadog | All-in-one infra/app/log monitoring | Dashboards, alerts, integrations | Track uptime, latency, memory spikes on WordPress servers |
| Prometheus + Grafana | Time-series metric collection & visualization | Custom dashboards, alerts via PromQL | Monitor traffic spikes, server trends, and cache usage |
| Nagios | Server/network alerting | Plugin-based alerts, uptime checks | Monitor WordPress server health in production setups |
| Zabbix | Comprehensive IT monitoring | Agentless, flexible metrics | Monitor backend (DB, PHP) and frontend uptime for WordPress |
Load Testing Tools:
| Tool Name | Purpose | Key Features | Relevance to WordPress/Server Monitoring |
|---|---|---|---|
ApacheBench (ab) | HTTP benchmarking | Simple CLI tool, RPS, latency distribution | Benchmark WordPress site performance across PHP versions, test response under load |
| Siege | Concurrent load simulation | Simulates many users, long-duration tests | Evaluate WordPress stability during traffic spikes and plugin stress |
| Locust | Distributed user behavior testing | Python-based scripting, real-world traffic simulation | Test how WordPress handles custom workflows and high concurrency |
WordPress-Specific Server Monitoring Tools:
| Tool Name | Purpose | Key Features | Relevance to WordPress/Server Monitoring |
|---|---|---|---|
| Query Monitor | Debugging performance issues in WordPress | Tracks slow DB queries, hooks, HTTP requests, PHP errors | Pinpoints slow plugins/themes and inefficient database queries |
| WP Server Health Stats | Displays server resource usage in WP admin | Shows CPU, RAM, disk usage inside WP dashboard | Great for non-technical users managing performance from WordPress backend |
| FlyWP | Server control panel built for WordPress | One-click performance tools, load testing, stats | Streamlined monitoring and optimization for WordPress (as shown in FlyWP’s tests) |
| New Relic for WordPress | Application-level performance insights | TTFB, transaction traces, plugin-specific bottlenecks | Detailed diagnostics of plugin and theme performance in real-time |
Log Analysis Tools:
| Tool Name | Purpose | Key Features | Relevance to WordPress/Server Monitoring |
|---|---|---|---|
| GoAccess | Real-time web log analyzer | CLI-based dashboards, IP tracking, status code breakdown | Monitor Apache/Nginx logs to spot 404 errors, slow requests, or spikes |
| ELK Stack | Centralized logging and visualization | Elasticsearch for indexing, Logstash for parsing, Kibana dashboards | Deep insights into PHP errors, WP-Cron jobs, and traffic anomalies |
| Fail2Ban | Security log monitoring and intrusion prevention | Monitors logs, bans IPs based on patterns (e.g., failed logins) | Protects WordPress from brute-force attacks or traffic surges |
| Graylog | Real-time stream processing, search queries, and alerts | Real-time stream processing, search queries, alerts | Detect recurring performance and security issues via filtered logs |
3. Set Up Monitoring and Alerts
To ensure proactive monitoring, configure your tools to collect data continuously and alert you to issues.
Define Baselines: Run benchmarks (e.g., using ApacheBench or Siege) to establish normal ranges for CPU, memory, RPS, and latency. For WordPress, test performance under typical traffic and during spikes (e.g., Black Friday sales).
Configure Thresholds: Set thresholds for critical metrics (e.g., CPU > 80%, memory > 90%, TTFB > 500ms). Use tools like Datadog or Nagios to define custom thresholds based on your server’s capacity.
Relevant Read: Which Servers Have the Best TTFB? A Comparison of DigitalOcean, Vultr, Google Cloud, and Hetzner for FlyWP
Set Up Alerts: Configure email, SMS, or Slack notifications for threshold breaches using tools like Zabbix or PagerDuty. Enable alerts for downtime, high error rates, or slow database queries.
Automate Monitoring: Use cron jobs or monitoring agents to collect metrics at regular intervals (e.g., every 5 minutes). Integrate tools like Prometheus with alerting systems for real-time issue detection.
4. Analyze Logs for Deeper Insights
Server logs provide a wealth of information for diagnosing performance issues.
Web Server Logs: Check Apache or Nginx logs (access.log and error.log) for slow requests, 5xx errors, or unusual traffic patterns. Use grep or awk to filter logs for specific error codes or IPs.
Database Logs: Enable MySQL slow query logs to identify queries taking longer than 100-200ms. Use tools like mysqltuner.pl to optimize database performance.
Application Logs: For WordPress, check wp-content/debug.log (if WP_DEBUG is enabled) for plugin or theme errors. Use Query Monitor to pinpoint slow-performing plugins or queries.
Log Analysis Tools: GoAccess: Generates real-time reports from access logs, showing RPS, response times, and error rates.
ELK Stack: Aggregates logs for advanced searching and visualization.
Graylog: Centralizes logs and provides alerting for specific events.
5. Test and Optimize Access Configurations
Benchmark Configurations: Use ApacheBench or Siege to test RPS and latency under different PHP versions or server settings (e.g., Apache vs. Nginx). Test with and without caching (e.g., Redis, Varnish) to measure performance gains.
Optimize Server Settings:
- PHP-FPM: Adjust
pm.max_childrenandpm.max_requestsbased on memory and traffic. - Nginx/Apache: Tune worker processes and connections for high RPS.
- MySQL: Optimize
innodb_buffer_pool_sizeandquery_cache_sizefor WordPress.
Test Under Load: Simulate traffic spikes using Locust or Siege to ensure the server handles peak loads without crashing. Monitor metrics like CPU, memory, and TTFB during tests.
6. Visualize and Review Trends
Visualization helps identify patterns and predict issues before they escalate.
Dashboards: Use Grafana with Prometheus to create dashboards for CPU, memory, RPS, and latency. Include WordPress-specific metrics like TTFB and slow queries.
Trend Analysis: Review weekly or monthly trends to identify recurring issues (e.g., memory spikes during backups). Correlate metrics with events like plugin updates or traffic surges.
Capacity Planning: Use historical data to predict when to scale resources (e.g., upgrading from Hetzner CCX23 to a higher-tier server).
7. Take Action Based on Insights
Monitoring is only effective if you act on the data. Here are optimization strategies:
CPU/Memory: Upgrade hardware or optimize resource-heavy processes (e.g., disable unused WordPress plugins).
Disk I/O: Switch to SSDs or NVMe drives for faster read/write speeds.
Network: Use a CDN (e.g., Cloudflare) to reduce latency and offload traffic.
Implement Caching: Use Redis or Memcached for object caching in WordPress. Enable page caching with plugins like WP Rocket or server-level solutions like Varnish.
Optimize WordPress: Minimize plugins and optimize themes to reduce database queries. Use Query Monitor to identify and fix slow queries or inefficient code.
Scale Resources: For cloud servers, enable auto-scaling to handle traffic spikes. Upgrade server plans for growing WordPress sites.
Security and Maintenance: Use Fail2ban or Wordfence to block malicious traffic that spikes resource usage.
Regularly update PHP, WordPress, and plugins to ensure performance and security.
8. Continuous Monitoring and Iteration
Server performance monitoring is an ongoing process. Regularly review your setup to adapt to changing traffic patterns or application needs.
- Schedule Reviews: Conduct monthly performance audits to reassess baselines and thresholds.
- Test New Configurations: Before deploying updates (e.g., PHP 8.3), test in a staging environment using tools like ApacheBench.
- Stay Updated: Monitor X or web sources for new tools or best practices in server monitoring.
Quick Cheat Sheet for Server Performance Monitoring
This cheat sheet is your rapid-fire guide to understanding key server performance metrics, identifying common issues, and implementing immediate fixes. It is designed for quick reference when every second counts. Bookmark it, print it, and keep it handy – because knowing what to look for and how to react can prevent minor glitches from becoming major disasters.
| Action | Command / Tool Example |
|---|---|
| Check CPU & Memory | top, htop, free -m |
| Monitor Disk Usage | df -h, du -sh /var/log |
| Review Disk I/O Wait | iotop |
| Check Network Traffic | iftop, netstat |
| Check Uptime | uptime |
| Restart Web Server (Apache) | sudo systemctl restart apache2 |
| Restart Web Server (Nginx) | sudo systemctl restart nginx |
Best Practices to Keep Your Server Healthy and Happy

You wouldn’t ignore a check-engine light, right? Your server deserves the same love. These best practices will help you catch problems early and keep things running like a well-oiled machine.
- Monitor 24/7. No excuses. Servers don’t sleep. Use automated monitoring tools to watch key metrics round the clock.
- Set realistic alerts. Only trigger alerts when it matters, like CPU > 85% for 10 minutes, not for a 2-second spike.
- Establish a performance baseline. Know what “normal” looks like for your server. This helps you spot when something’s off before it breaks.
- Visualize with dashboards. Metrics are easier to read when they’re not buried in logs. Tools like Grafana, Datadog, or Netdata make it simple.
- Check logs weekly. Scan your Apache/Nginx logs, error logs, and access logs regularly for hidden issues.
- Audit your stack every quarter. Is your current setup still serving your needs? Or are you duct-taping over slowdowns?
- Document everything. From alert thresholds to firewall rules, keep a simple log of what you’ve changed.
FAQs: Quick Answers to Your Server Monitoring Questions
Q: How often should I monitor my server?
A: Constantly. Seriously. Use a monitoring tool with real-time alerts so you’re not checking metrics manually every hour.
Q: Can I monitor a shared hosting server?
A: Only partially. Most shared hosting doesn’t give you root access, so you can’t use advanced tools. Consider switching to a VPS or cloud server for full control.
Q: What should I do if my CPU usage spikes?
A: Check which process is hogging resources using top or Task Manager. It could be a plugin, a theme, or something gone rogue.
Q: What are the signs of bad disk I/O?
A: Slow page loads, delays in database queries, or high I/O wait time in your monitoring dashboards. Time to check your storage health.
Q: How much free disk space should I keep?
A: Always keep at least 15–20% free. Running out of space can cause logs to stop, backups to fail, and apps to crash.
Q: Is it worth investing in paid monitoring tools?
A: If you’re running a mission-critical app or a busy WooCommerce store, yes. Tools like New Relic or Datadog can save your bacon when things go sideways.
Q: Can monitoring tools help with security, too?
A: Absolutely. A sudden spike in traffic or login attempts? It might be a DDoS or brute-force attack. Some tools even integrate with firewalls.
Wrapping Up: Keep Your Server Running Like a Pro
You’ve got the blueprint for server success. From tracking CPU and memory to optimizing WordPress database queries, you know the critical metrics that keep your systems humming. You’ve discovered tools some lightweight, others powerful to monitor performance and spot issues early. Don’t wait for user complaints or a server meltdown to act.
- Configure alerts to catch problems fast.
- Dive into logs to uncover hidden issues.
- Stress-test your setup to handle traffic spikes.
Stay proactive, not reactive. For WordPress users, tools like FlyWP simplify the process with real-time insights and WordPress-optimized management, ensuring your site stays fast and reliable. The best time to prevent a server issue? Before it strikes. The next best time? Right now.
